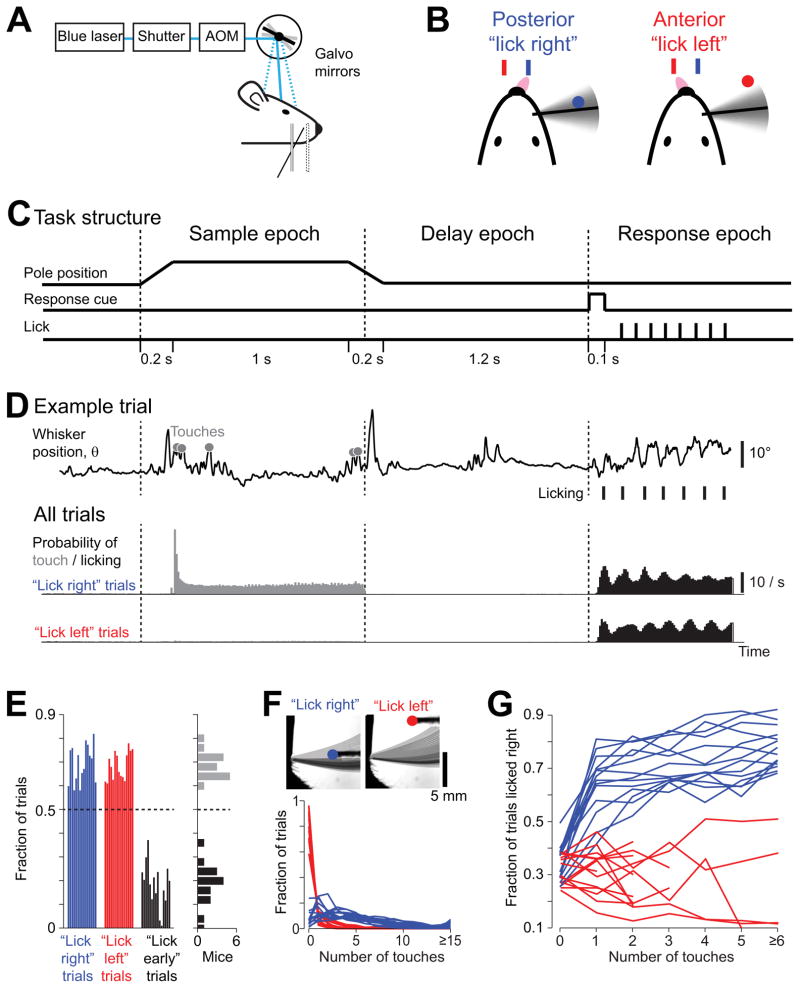
Figure 1. Object location discrimination task with a delay epoch.
(A) Head-fixed mouse performing object location discrimination under optogenetic perturbation.
(B) A mouse producing “lick right” and “lick left” responses based on pole location.
(C) Task structure. The pole was within reach during the sample epoch. Mice responded with licking after an auditory response cue.
(D) Behavioral data. Top, one example trial. Whisker position (azimuthal angle, θ) for a representative “lick right” trial. Touches, grey circles; licks, black ticks. Middle, Summary data for “lick right” trials in 8 mice. Probability of touch, grey; licking, black (10 ms time bin). Bottom, same as middle for “lick left” trials.
(E) Behavioral performance across mice. Left, fraction correct “lick right” (blue), “lick left” (red), and “lick early” (black) trials. Each bar corresponds to one mouse (n = 15). Right panel, histogram of performance (grey) and fraction of “lick early” trials (black) across individual mice.
(F) Top, whisker density for representative “lick right” and “lick left” trials (overlaid whisker images). Bottom, distribution of the number of touches in “lick right” and “lick left” trials. Each line corresponds to one mouse (n = 14).
(G)The fraction of “lick right” responses as a function of number of touches for “lick right” (blue) and “lick left” (red) trials (n = 14). One mouse from (E) was excluded because there were not enough trials to sort by the number of touches (Table 1). See also Figure S1.

