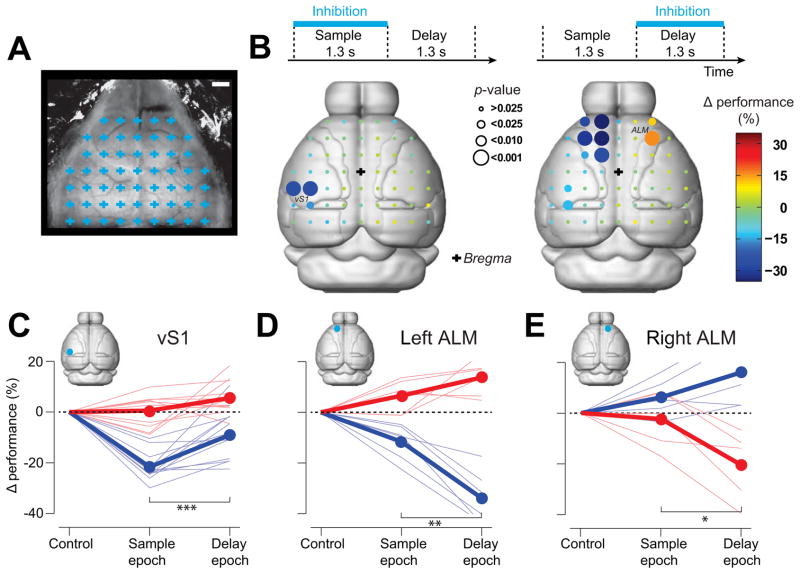
Figure 4. Cortical areas involved in object location discrimination revealed by photoinhibition.
(A) A grid of 55 photostimulus locations through the clear-skull cap (grid spacing, 1 mm). Each grid location was chosen randomly for photostimulation during either sample or delay epoch (see Experimental Procedures). Scale bar, 1 mm.
(B) Photoinhibition during different behavioral epochs. Top, photoinhibition during sample (left) and delay (right) epochs. Bottom, cortical regions involved in object location discrimination during sample (left) and delay (right) epochs in “lick right” trials. Color codes for the change in performance (%) under photoinhibition relative to control performance. Circle size codes for significance obtained from bootstrap (Experimental Procedures; from small to large; > 0.025, < 0.025, < 0.01, < 0.001). Effects on “lick left” trials are shown in Figure S6. Boundaries of cortical areas are from Allen Brain Atlas (Brain Expolorer 2, www.brain-map.org).
(C) Photoinhibition of vS1 during the sample epoch caused a larger behavioral deficit than during the delay epoch in “lick right” trials (***, blue, “lick right” trials, p < 0.001, n = 12, two tailed t-test). Thick lines, mean; thin lines, individual mice.
(D) Photoinhibition of the left ALM during the delay epoch caused a larger behavioral deficit than during the sample epoch in “lick right” trials (**, blue, “lick right” trials, p = 0.0016, n = 6; two tailed t-test; red, “no” trials, p = 0.09).
(E) Photoinhibition of the right ALM during the delay epoch caused a larger behavioral deficit than during the sample epoch in “no” trials (blue, “lick right” trials, p = 0.22, n = 5; *, red, “no” trials, p = 0.05, two tailed t-test). See also Figure S6.

