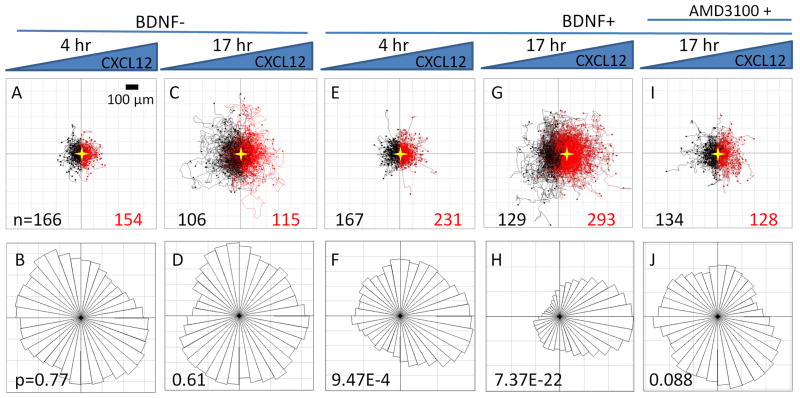
Figure 3.
NSC cell tracks and angular histograms of cell endpoint positions. Individual cell tracks (A,C,E,G,I) are plotted with all cell initial positions at the origin (0,0). The number of cells migrating towards (red tracks) or away from (black tracks) the CXCL12 source is given for each condition. The center of mass for the endpoint positions is marked with a gold star. For angular histogram plots (B,D,F,H,J), the Rayleigh p-value of each endpoint distribution is shown, with p < 0.05 suggesting a statistically significant asymmetric distribution. No significant NSC chemotaxis towards CXCL12 was observed during 4-hr (A,B) or 17-hr (C,D) observations. A 1-hour BDNF pretreatment induced chemotaxis towards CXCL12 during both 4-hr (E,F) and 17-hr (G,H) observations. Treatment with AMD 3100 for 1 hr following a 1-hr BDNF exposure caused a loss of directional cell migration towards CXCL12(I, J).

