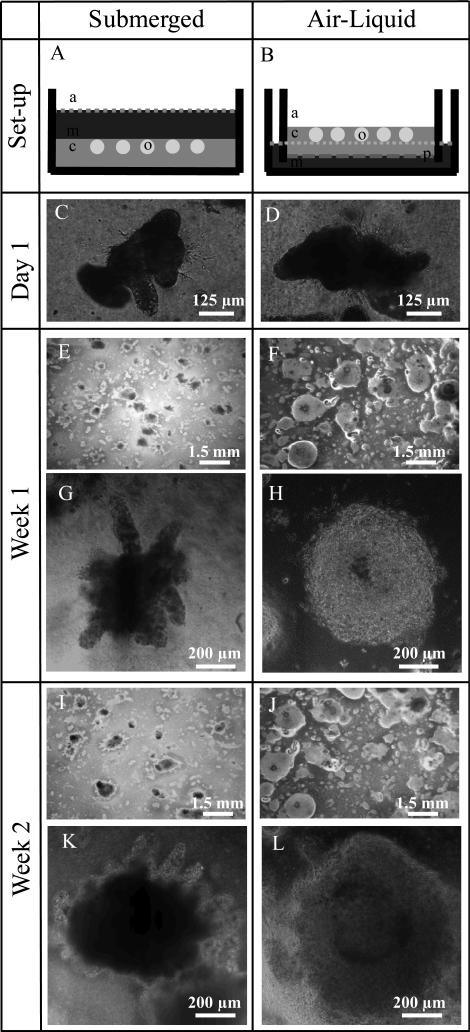
Figure 2.
Schematic of A) submerged and B) air-liquid interface culture configurations in which “a” indicates air, “m” indicates culture medium, “c” indicates the encapsulating collagen matrix, “p” indicates the porous membrane, and “o” indicates the primary intestinal organoid. Bright field images of varying magnification are shown after C,D) one day, E-H), one week, and I-L) two weeks of culture.

