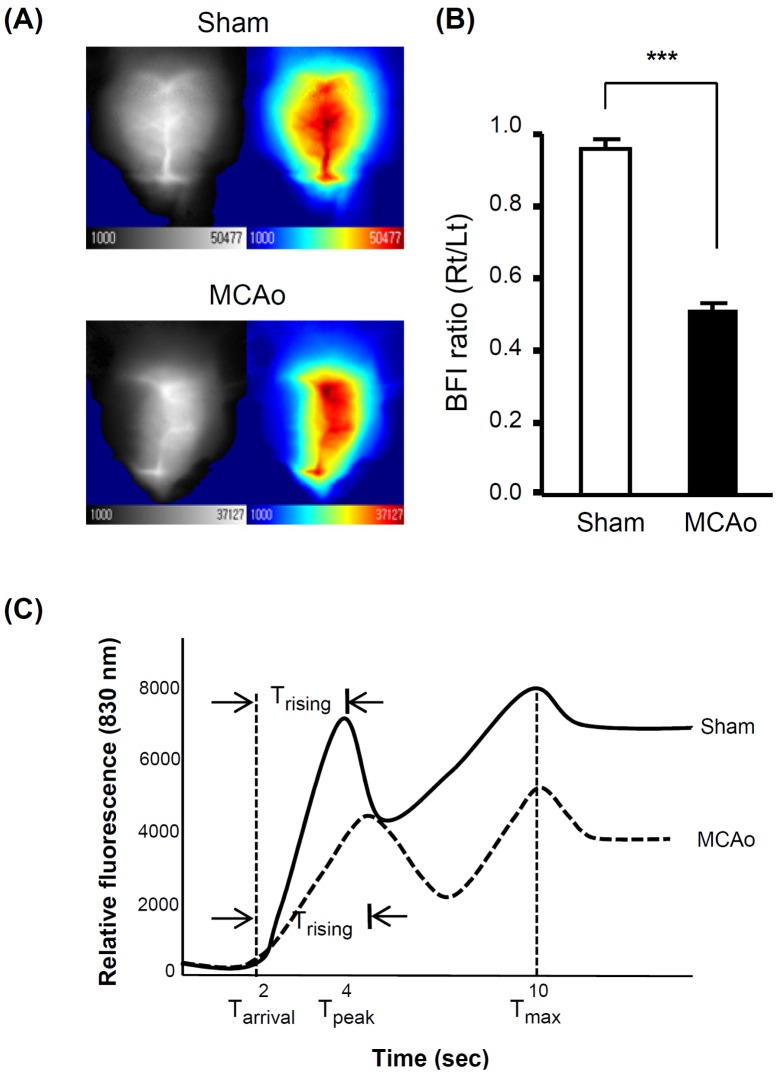
Fig. 3.
Verification of MCAo by CBF measurement during occlusion. (A) Representative CBF maps in the sham and a MCAo animals. Local CBF was decreased in the right hemisphere of the MCAo animals while there was no change in the sham animals. (B) The relative CBF are presented as the BFI ratio of the ipsilateral (right) to contralateral (left) hemisphere. BFI ratio was significantly decreased in the MCAo animals but not in the sham-operated animals. All data are presented as means±S.D. from 7 and 20 animals from the sham-operated and MCAo animals, respectively. (C) The graphs show the representative fluorescent signals of sham-operated (solid line) and MCAo (dotted line) animals. It should be noted that Trising, the duration between the arrival time (Tarrival) and the first peak time (Tpeak), was increased in the MCAo animal (t-test, ***p<0.001).

