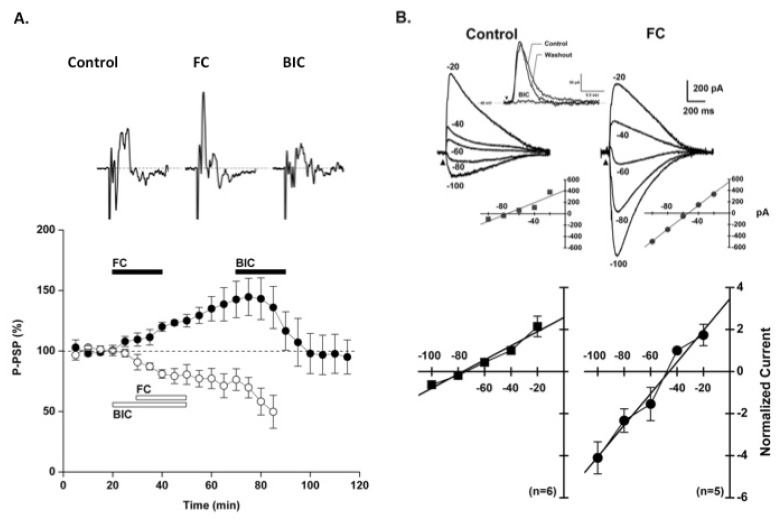
Fig. 5.
Effect of FC on EGABA. (A) Average of five consecutive field potentials evoked in DHs by dorsal root stimulus before ("Control"), 10 min after exposure to FC ("after FC"), and after exposure to ACSF containing 20 µM Bic ("after Bic"). Plot showing average across-slice (n=4) effect of Bic application on LTP associated with exposure to FC. (B) Upper panel shows GABA puff-evoked currents recorded from DHs neuron before and after exposure to FC. A 300 msec puff of 1 mM GABA was applied at each of the indicated holding potentials. EGABA prior to FC was approx. -75 mV; EGABA 20 min after FC was approx. -50 mV. Current-voltage (IV) plots derived from observations obtained from same neuron shown under voltage clamp recordings. Lower panel shows Plot of normalized average across-neuron I-V plot obtained before (on left; n=6) and after exposure to FC (on right; n=5). Normalization procedure: current measured from each neuron at each holding potential is expressed in terms of the current measured from same neuron/condition at -40 mV. Estimates X-intercept of best fitting linear regression line is -76.5 mV for observations obtained before FC, and -46.1 mV after FC. Flags indicate ±1 S.E.M.

