
Figure 2.
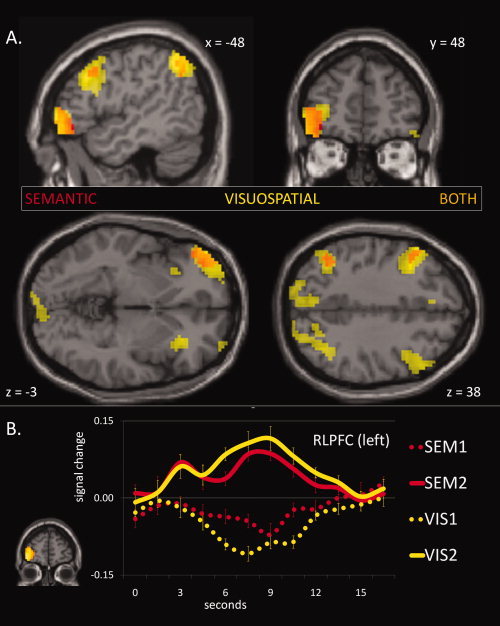
(A) Activation clusters associated with relational integration (second‐order >first‐order). Clusters associated with visuospatial integration (VIS2 > VIS1) are shown in yellow, while clusters associated with semantic integration (SEM2 > SEM1) are shown in red; overlap is shown in orange. Images are thresholded at P < 0.001 (uncorrected) with a 10‐voxel extent threshold. (B) BOLD activation timecourse associated with the RLPFC activation cluster. Error bars show the standard error of the mean at each timepoint.