
Figure 3.
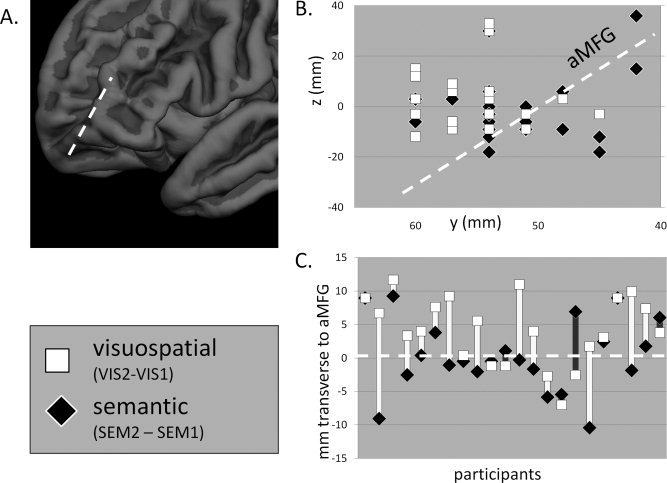
Results from the topographical analysis of left RLPFC. (A) Dotted line depicts the orientation of aMFG. (B) MNI y and z coordinates of activation peaks, from each subject, for the semantic integration (SEM2 > SEM1) and visuospatial integration (VIS2 > VIS1) contrasts. The dotted line corresponds to the orientation of aMFG. (C) Within‐subject differences, in the direction transverse to aMFG, between the peaks coordinates associated with semantic and visuospatial integration.