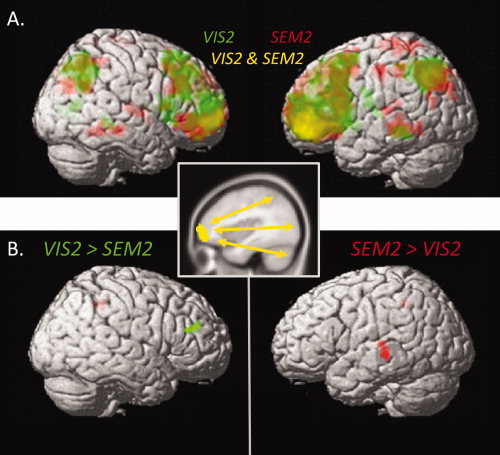
Figure 4.

Functional connectivity maps, obtained via β‐correlations analysis with a left RLPFC seed (inset). (A) Overall connectivity with left RLPFC, separately for semantic (red) and visuospatial (green) trials, at P < 0.001 uncorrected. Areas of overlap are shown in yellow. (B) Clusters demonstrating differential connectivity with left RLPFC, for VIS2 > SEM2 (right DLPFC, green, P < 0.005 uncorrected) and SEM2 > VIS2 (left MTG, red, P < 0.001 uncorrected).
