
Figure 4.
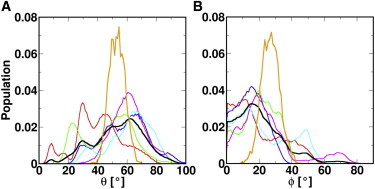
The population distributions of (A) θ and (B) ϕ in all the systems. Different sets of simulations are distinguished by colors: cav1_45 (red); cav1_55 (green); cav1_65 (blue); cav1_75 (magenta); cav1_85 (cyan); and 1-μs simulation results (orange). Averaged distributions from all the 100-ns systems are shown in black. To see this figure in color, go online.