
Figure 6.
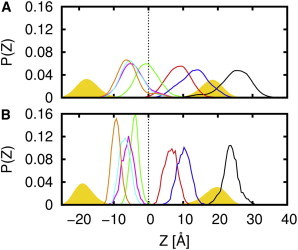
The ZCOM distributions for W85 (black), W98 (red), W115 (green), and W128 (blue), and the break residues G108 (magenta), I109 (cyan), and P110 (orange) in (A) the multiple Cav182–136 systems and (B) the 1-μs simulation. The histograms in panel A are averaged over all 50 multiple simulations. The bilayer center is indicated by dashed black lines. Distribution of lipid phosphate atoms is shown by yellow filled regions. An illustration of the approximate relative positions of these residues on Cav182–136 can be found in Fig. 3B. To see this figure in color, go online.