
Figure 8.
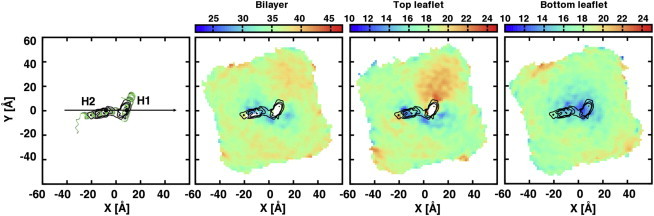
The membrane thickness profiles. Before making the profiles, the caveolin-1 molecules are aligned so that the vector connecting the centers of H2 and H1 coincides with the X axis (H2 on the left). The following plots are the thickness profiles of the bilayer, the top leaflet, and the bottom leaflet, respectively. Results from system cav1_65_3 are shown. To calculate the profile, a two-dimensional grid is placed on the XY plane on top of the protein. For each grid point, the averaged Z positions of the phosphate atoms at the top and bottom leaflets are computed. These Z values represent the thickness of the top and bottom leaflets, respectively. The difference indicates the entire bilayer thickness. (Color scale in the plots goes from blue to red with increasing thickness.) Grid points with no phosphate atom present are excluded from the thickness calculations (black contour lines). Density of the protein is plotted on the XY plane to show the regions of caveolin-1 that are responsible for membrane perturbation. To see this figure in color, go online.