
Figure 4.
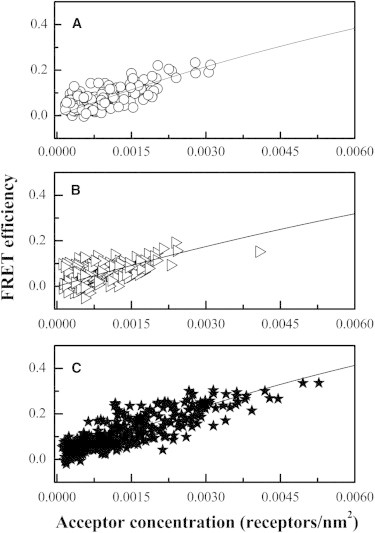
Fits of the model for monomer proximity FRET to the measured FRET efficiencies, yielding the optimal distances of closest approach, L, shown in Table 1. (A) truncated ErbB1 labeled with either YFP or mCherry in CHO derived vesicles, (B) truncated ErbB2 labeled with either YFP and mCherry in HEK 293T derived vesicles, and (C) truncated ErbB1 labeled with YFP and FGFR1 labeled with mCherry in CHO derived vesicles.