
Figure 1.
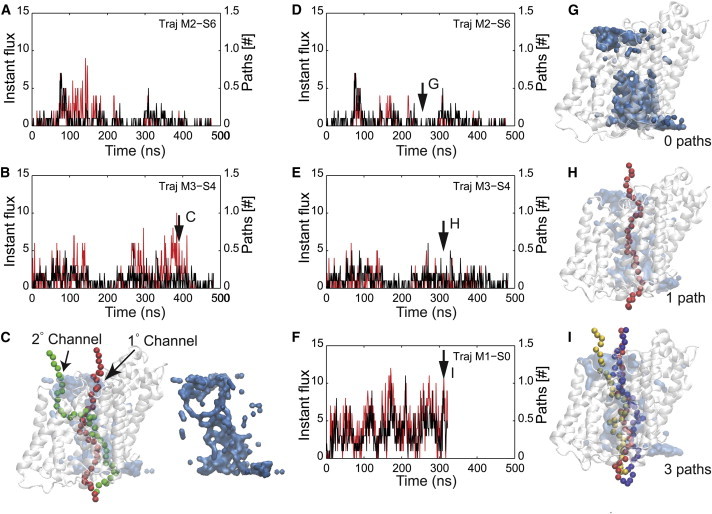
Instantaneous water flow and the identification of water channels. (A and B) Total number of independent water pathways (red) and maximum instantaneous water flow (black) versus time for two representative trajectories. Instantaneous water flux is defined as the number of upward or downward permeation events in 1 ns, and the maximum instantaneous water flux is the larger of these two values. The independent water pathways are the average number of paths identified from the lower bulk to the upper bulk averaged over 1 ns. The red and black curves show marginal agreement, but there are noticeable exceptions, for instance at 375 ns in B, where there are many paths through the transporter even though the water flux is low. The black arrow in B indicates the time from which the snapshot in C is taken. (C) Visualization of the water pathways when the instantaneous water flow and the total pathways are poorly correlated. The snapshot corresponds to the time indicated in B (black arrow). In the snapshot at left, vSGLT is white, and the molecular surface representation of the water is light blue. Two pathways are present: the main channel (red) and a secondary channel (green). Additional analysis revealed that water movement through the secondary channel is slow, and that the primary channel is responsible for the majority of the water flux. At right, the water surface is pictured alone to show clearly the trajectories of the two independent and contiguous pathways. (D–F) Removal of secondary-channel data results in excellent correlation between pathway numbers (red) and maximum instantaneous water flow (black). Pathways that ran through the secondary site (C, green path) were systematically removed, resulting in marked improvement in the correlations shown in A and B, as can be seen in D and E, respectively. Simulations represented in D–F show an increasing degree of channel openness, as well as an increasing degree of water flux. (G–I) Snapshots with zero (G), one (H), and three (I) independent pathways corresponding to the plots in D–F, respectively. The color scheme is as in C. In each snapshot, the oxygen atoms from independent pathways are represented by different colors. To see this figure in color, go online.