
Figure 2.
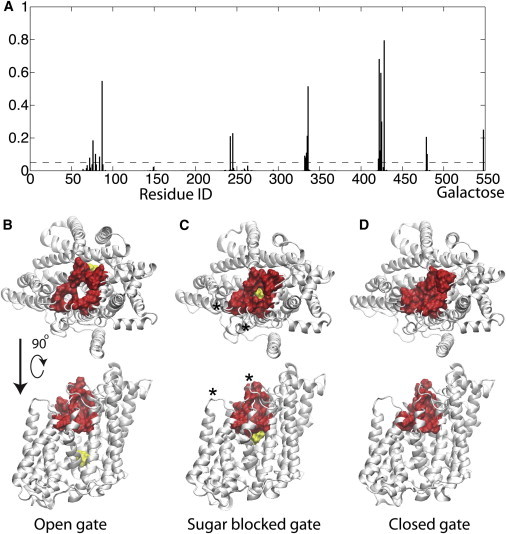
Identification of residues that control the number of water pathways. (A) Probability of a protein residue or galactose being identified in a gap region. Probability is calculated as the number of total observations divided by the total frames involving water gaps. The x axis is the protein residue number in vSGLT with galactose (1–547), with the galactose being the final value. The dashed line corresponds to a 5% (0.05) probability. (B–D) All residues observed in >5% of gaps were highlighted (red) on the vSGLT structure (white) in high water flux (B) and in two low-water-flux states (C and D). Galactose is yellow. Each structure is shown from the extracellular space (upper) and from the membrane (lower). In B, the residues form an annulus with an open center. The side view shows that all residues are localized to the extracellular side of the transporter. In C, the residues form an open annulus, but with the sugar plugging the hole, which explains why no water pathways are found in this snapshot. The asterisks indicate the positions of the insertion sites described in Fig 4 and the Discussion. In D, it can be seen that the outer residues all come together to occlude the outer gate and prevent water pathways through the channel. All of the molecular images were rendered using VMD (61). To see this figure in color, go online.