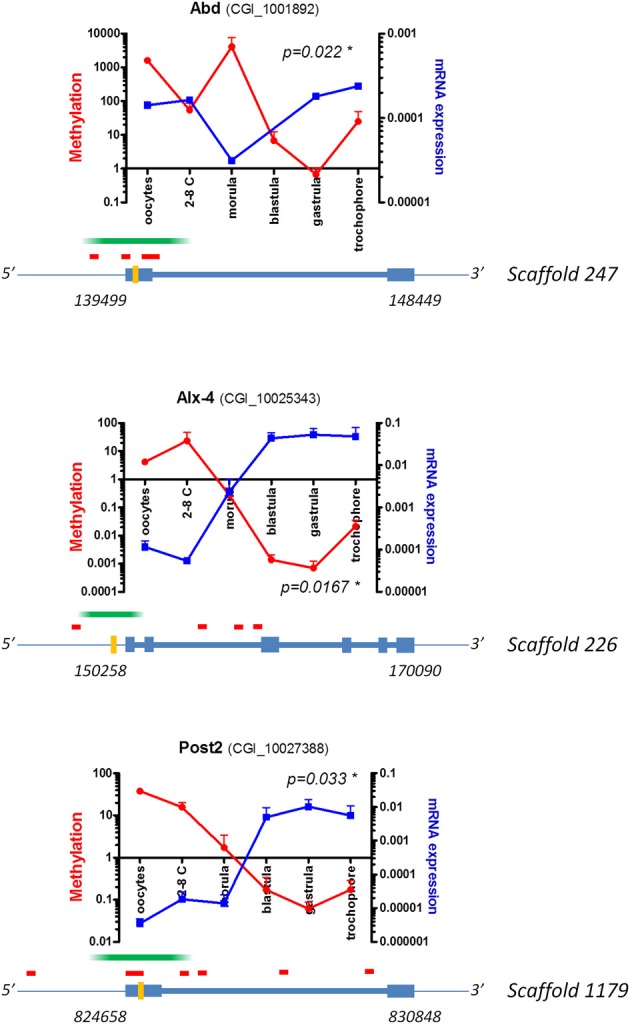
Figure 1.

The methylation of 5′ regions can drive transcriptional repression during oyster development. Examples of development genes showing patterns suggestive of DNA methylation bias in upstream domains. DNA methylation (red) investigated by MeDIP-qPCR and cognate mRNA expression (blue) measured by RT-qPCR are shown for the C. gigas Abd, Alx4 and Post2 putative orthologs (development stages and GenBank accession numbers are indicated). The diagrams represent the genomic and methodological contexts. Scaffold numbers correspond to the fragment considered in the present assembly of the oyster genome (Zhang et al., 2012), start and stop positions (italic); intergenic (thin line), introns (thick line), exons (rectangles), putative MeDIPped fragments (green), qPCR amplified regions (orange), and CpG islands (red) are represented (modified from Riviere et al., 2013). *p < 0.05 Pearson or Spearman's correlation test between methylation and mRNA expression.
