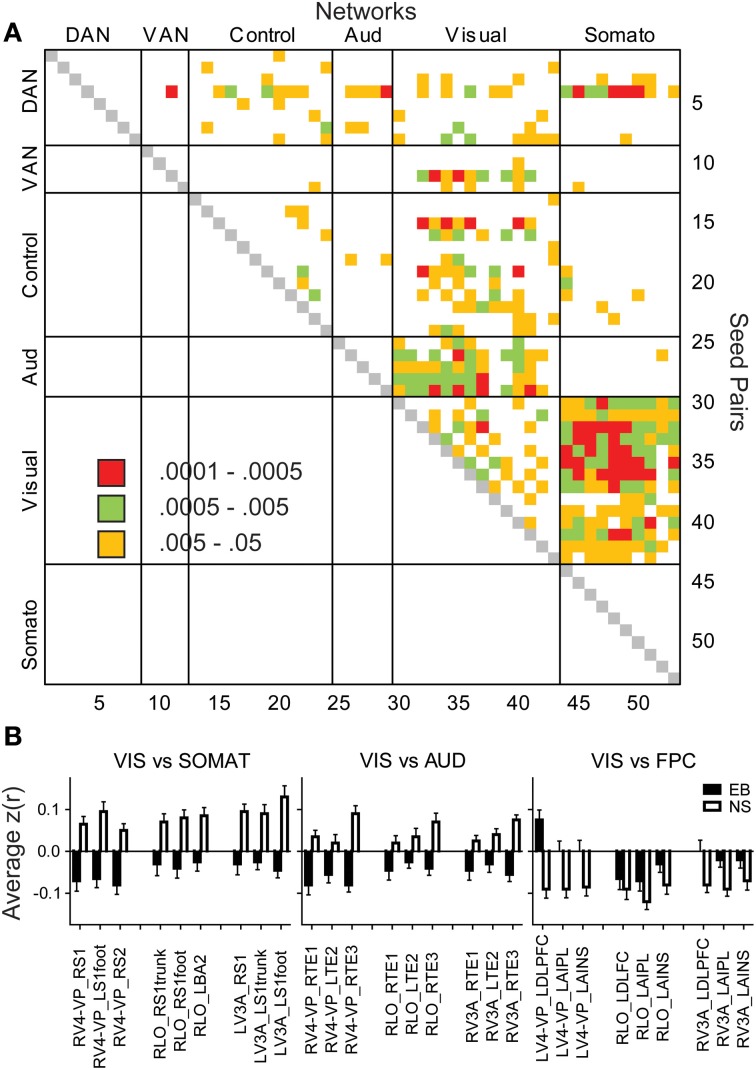
Figure 2.
Matrix of significant group differences in temporal correlation coefficients (A). Seed pairs correspond to ROI Numbers listed in Table 2. Filled cells indicate p-values of t-tests. (B) Bar graphs of mean and standard errors for temporal correlation coefficients in each group. ANOVAs of each bar graph had a significant group effect (p < 0.001) in seed pairs for visual vs. somatosensory, auditory, or control networks.

