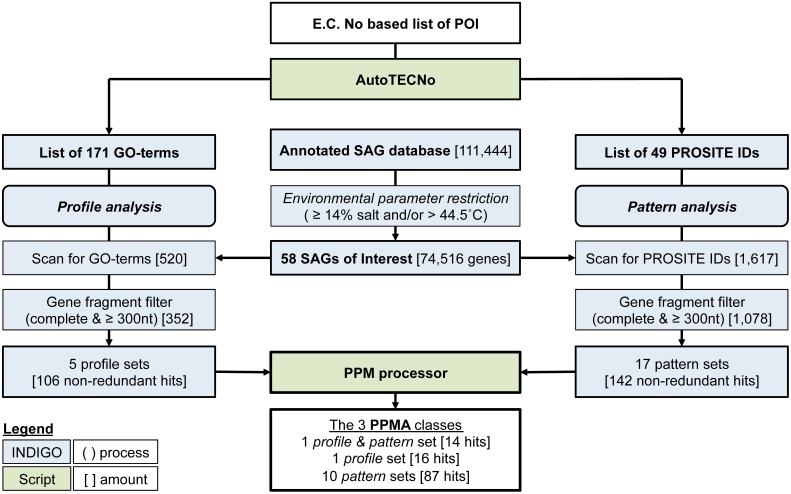
Figure 2.
Flowchart illustrating the PPM (profile pattern matching) algorithm, starting from an E.C. Number based proteins of interest (POI) list and a selected database subset, which may also be uploaded externally. Numbers refer to the example published here. Square brackets indicate number of genes at each step during the example analysis, specific restriction filters are described in normal brackets. The complete PPM algorithm is available at the INDIGO webpage including the scripts AutoTECNo and PPM Processor.

