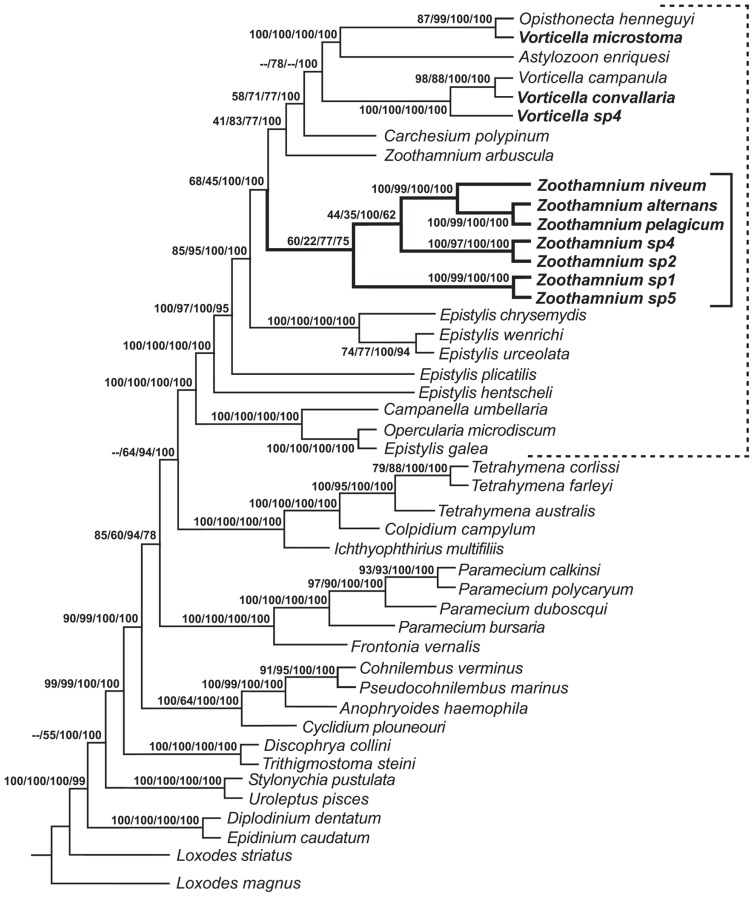
FIGURE 2.
Consensus tree formed from the four trees generated by phylogenetic analyses (Clamp and Williams, 2006). Neighbor-joining (NJ) bootstrap value, maximum parsimony (MP) bootstrap value, maximum likelihood (ML) consensus value, and Bayesian consensus value are given as numbers on branches; missing values reflect minor differences in topology that could not be represented on the consensus tree. Solid bracket indicates species of Zoothamnium; dashed bracket indicates species of peritrichs. Species sequenced in Clamp and Williams (2006) are shown in bold type.

