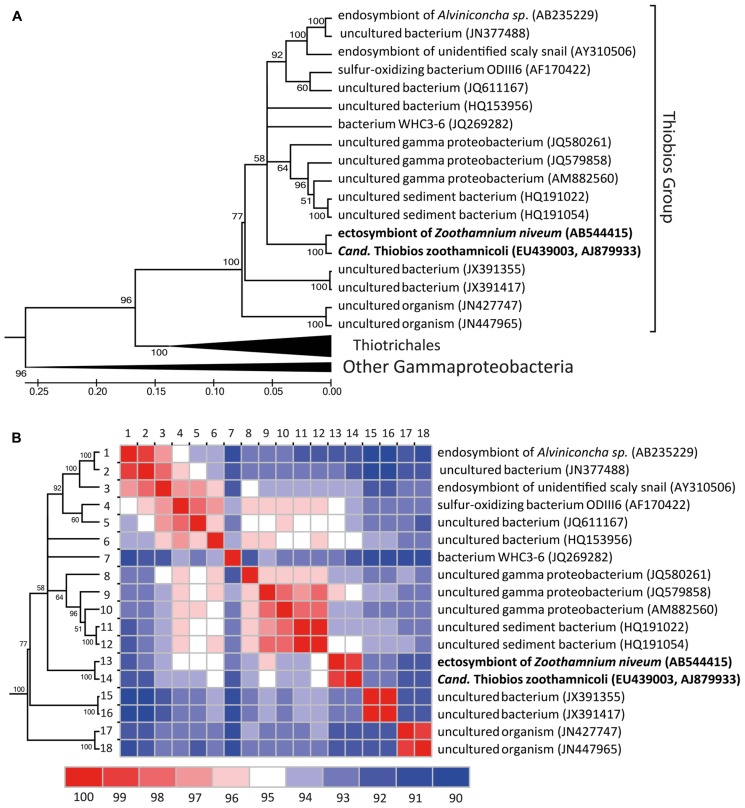
FIGURE 6.
Phylogenetic diversification of the Cand. Thiobios zoothamnicoli neighborhood. (A) Maximum likelihood phylogenetic tree (GTR model, 1000 bootstraps) of all long (>1300 nt), with good pintail value (>60) and non-redundant 16 rRNA sequences similar to Cand. Thiobios zoothamnicoli available in the SILVA database (Quast et al., 2013). The tree with the highest log likelihood is shown and is drawn to scale, with branch lengths measured in number of substitutions per site. Evolutionary analyses were conducted in MEGA5 (Tamura et al., 2011). (B) Similarity matrix of the 16S rRNA sequences belonging to the Cand. Thiobios zoothamnicoli group. The similarity was calculated as the percentage of identical positions over all shared positions (not considering gaps) for each pair of sequences in the multiple sequence alignment and visualized using JColorGrid (Joachimiak et al., 2006).

