
Figure 5. Effect of TSCE on protein expression of Cu,Zn-SOD, GPx, and CAT in H2O2-treated cells.
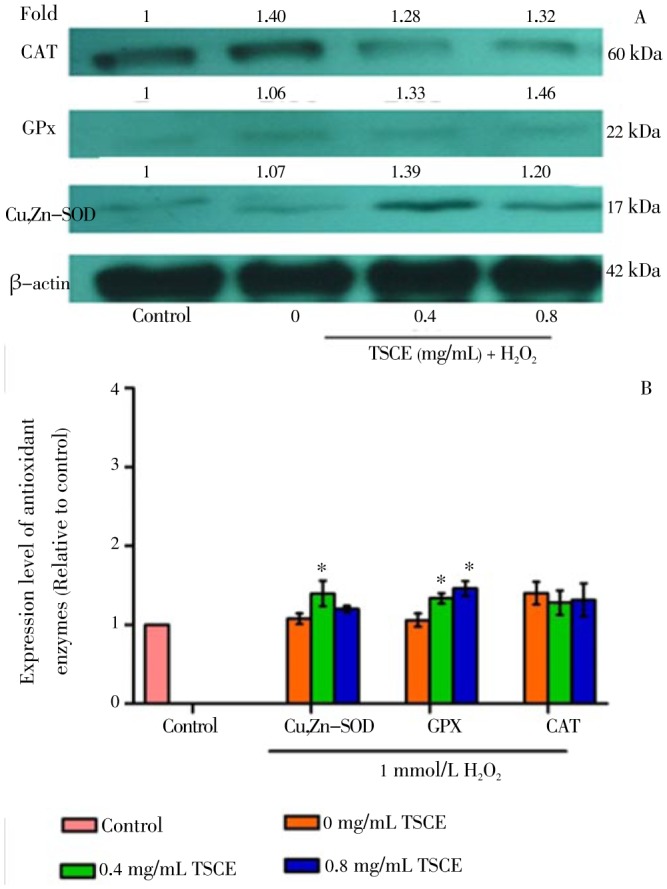
The cells were treated with TSCE at 0.4-0.8 mg/mL for 24 h followed by 1 mmol/L H2O2 for 3 h. (A) Cu,Zn-SOD, GPx, and CAT protein levels and (B) the intensity of each band after incubated with 1 mmol/L H2O2 for 3 h. Data are expressed as mean±SEM (n=3). *P<0.05 compared to the vehicle control.