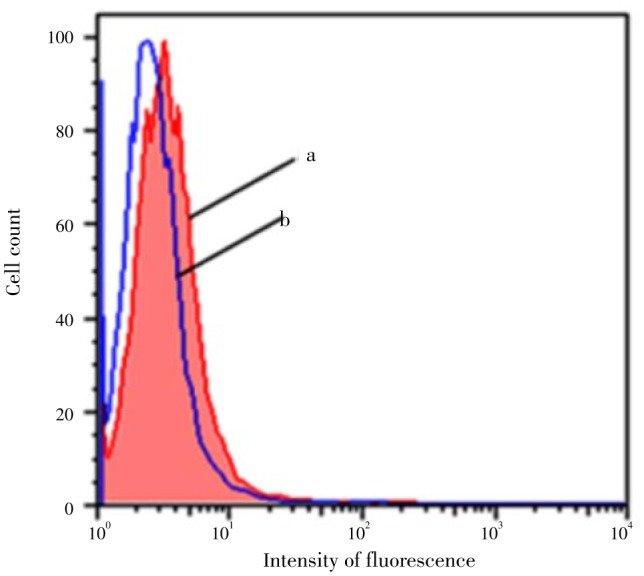
Figure 3. The DNA-oxidation protection activity of S. fruticosa extract as evaluated by flow cytometry.

a: Represents the flow cytometry histogram for cells without S. fruticosa extract treatment; b: Represents the flow cytomety histogram for cells incubated 3 h with 100 µL S. fruticosa extract. Data are representative of 6 independent experiments; the mean values of the histograms (a, and b) are statistically different (P<0.05).
