
Figure 1. Infectivity.
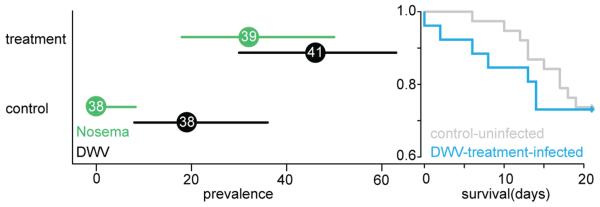
Prevalence of infections in treated Bombus terrestris workers 21 days after inoculation (in percent). Bars indicate 95% confidence intervals. Colours indicate treatment, with Nosema treated samples in green and DWV treated samples in black. Sample sizes are given inside the mean data point. The survival graph over the 21 day test period shows uninfected control treatments in grey compared to infected DWV treatments in blue (Cox mixed effects model fitted with penalized partial likelihood: X2 = 11.93, df = 4.17; p < 0.021, see Supplementary Information).