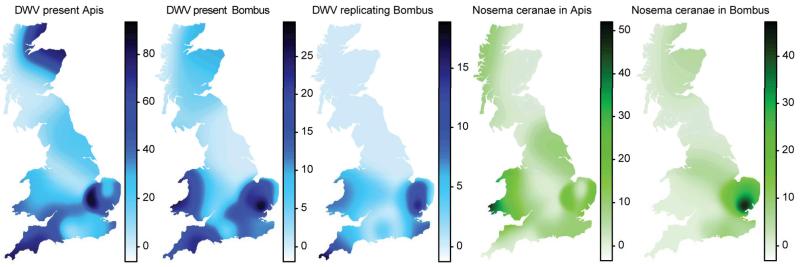
Figure 2. Prevalence.
Estimated pathogen prevalence in Apis and Bombus across Great Britain and the Isle of Man. Colour gradient (based on Gaussian kernel estimators with an adaptive bandwidth of equal number of observations over 26 sites, see Methods) corresponds to percent prevalence (note different scales). DWV prevalence is displayed in blue and Nosema prevalence in green.

