Figure 3.
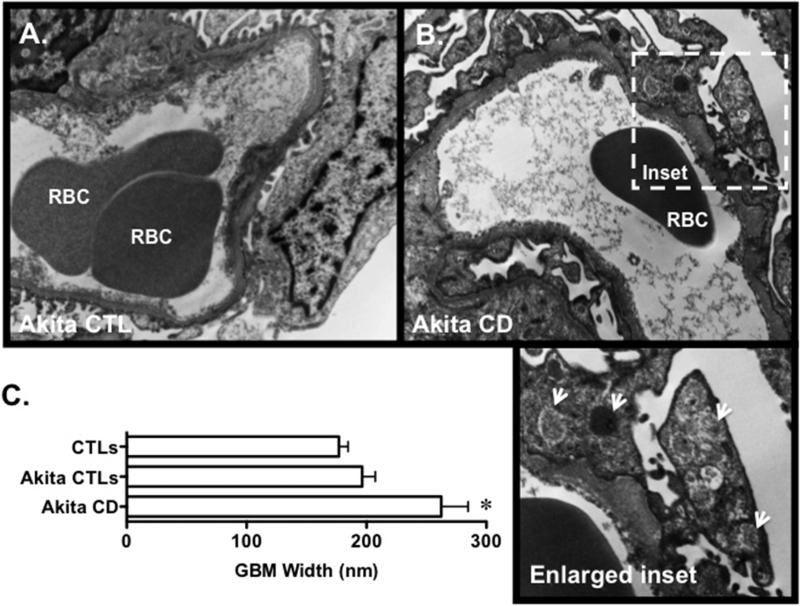
(A-B) Glomerular ultrastructure was evaluated using TEM. Focal areas of foot process effacement were observed in both groups of Akita mice, which was qualitatively more severe in the Akita CD group compared to Akita CTLs. Akita CD mice also demonstrated frequent cytoplasmic vesicular inclusions (arrows, enlarged inset) and a variable increase GBM width (200-900 nm). In contrast, vesicular inclusions and GBM thickening was not observed in Akita CTLs. (C) Quantitation of GBM width revealed a significant increase in Akita-CD mice compared to CTL animals. Three mice were studied in each group. *P<0.01 vs. CTLs and Akita CTLs

