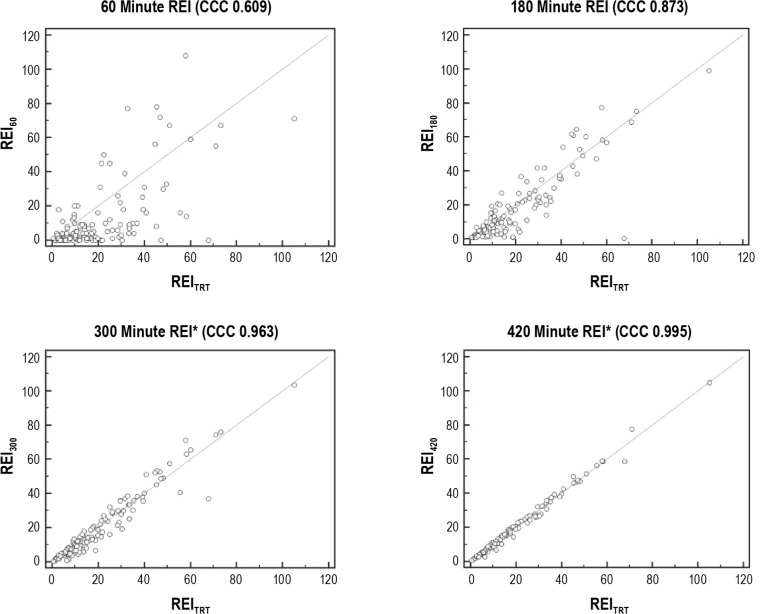
Figure 2.
Scatterplots for the respiratory event index (REI) at each time interval versus the REI for the total recording time (REITRT). The concordance correlation coefficient (CCC) measures the amount of variation from the y = x line and ranges from -1 to 1, where 1 is perfect positive agreement and 0 is no agreement. The scatterplots for the 60-, 180-, 300-, and 420-min intervals demonstrate improving agreement with increasing recording time duration. Strong concordance is denoted by the asterisk.

