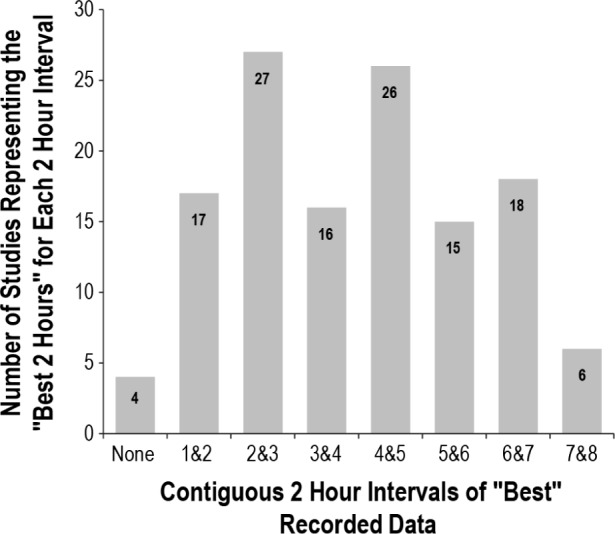
Figure 4.

Distribution of the “best 2 hours” during the recording period This represents the distribution of the “best contiguous 2 hours” chosen out of the total recording time. For example, the 17 studies listed for “1 & 2” means that the best 2 hours occurred during the first and second hours of the recording for those studies.
