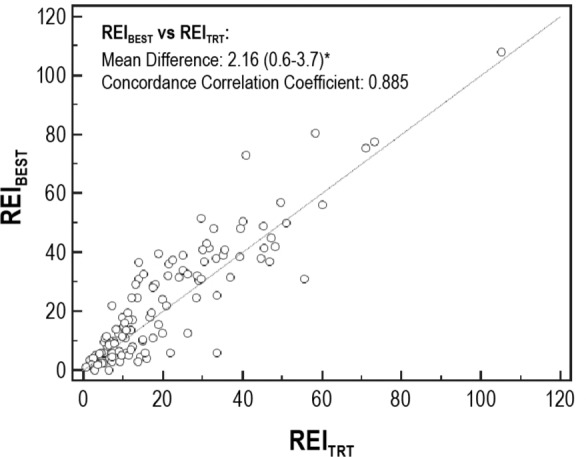
Figure 5.

Scatterplot of the respiratory event index for the “best 2 hours” (REIBEST) versus the REI for the total recording time (REITRT). This scatterplot demonstrates the weak correlation between the REIBEST and REITRT with the results straying from the y = x line, with a concordance correlation coefficient of 0.885, which is not strongly concordant. Statistical significance is denoted by the asterisk.
