
Figure 5.
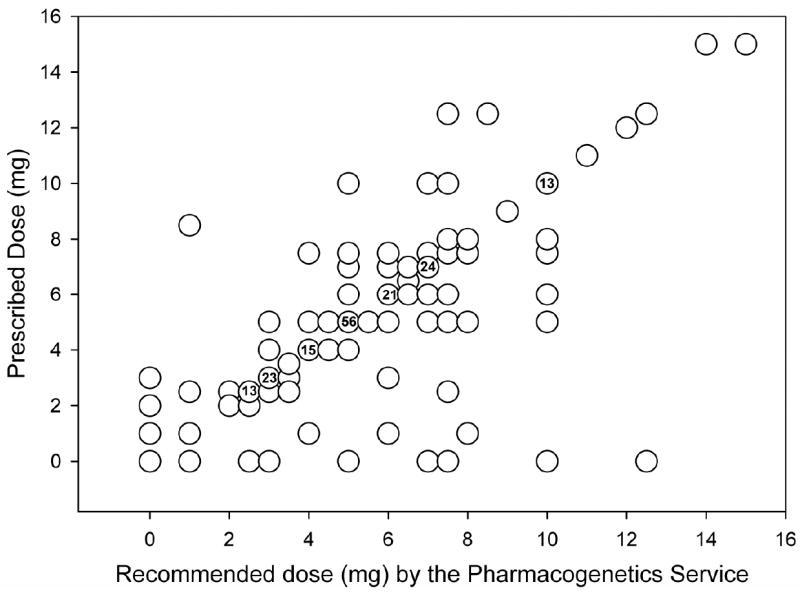
Scatter plot of dose recommended by the pharmacogenetics service versus the dose ordered by the primary team. The numbers within the circles indicate the number of times that dose combination occurred. For circles without numbers, the combination only occurred once.