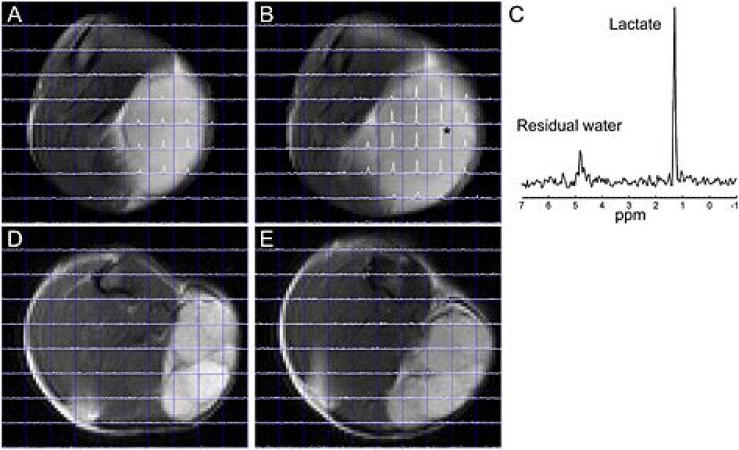
Figure 1.
Lactate spectra superimposed on T2-weighted images in R3327-AT and Dunning H tumors. The lactate spectra in the AT tumor imaged at V = 296 mm3 (A) and V = 1455 mm3 (B) show well-defined lactate peaks. The spectrum of the voxel in panel (B) marked with an asterisk is shown in panel (C). In contrast, the Dunning H tumor imaged at V = 227 mm3 (D) and V = 1364 mm3 (E) shows no lactate.

