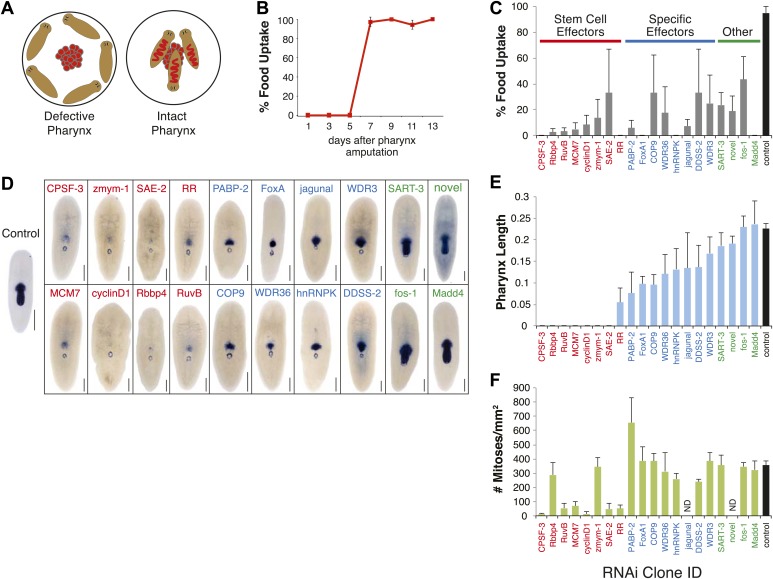
Figure 3. RNAi screen for genes affecting pharynx regeneration.
(A) Schematic of feeding assay. (B) Animals recover ability to ingest food 7 days after chemical amputation. For each timepoint, n = 10 animals, repeated in triplicate. Error bars = SD. (C) Quantification of feeding behavior of RNAi-treated animals 10 days after amputation. Shown are averages of three independent experiments; error bars = SEM, n ≥30 animals. Smed-laminin in situ hybridization shows extent of pharynx regeneration defects in RNAi-treated animals. Scale bars = 250 μm. (E) Quantification of pharynx length in RNAi animals 11 days after amputation. For each bar, n = 6–10 animals; error bars = SD. (F) Mitotic activity of whole animals 3 days after pharynx amputation measured by phosphoH3-Ser10 staining. Error bars represent SD, and n = 8 animals for each condition.


