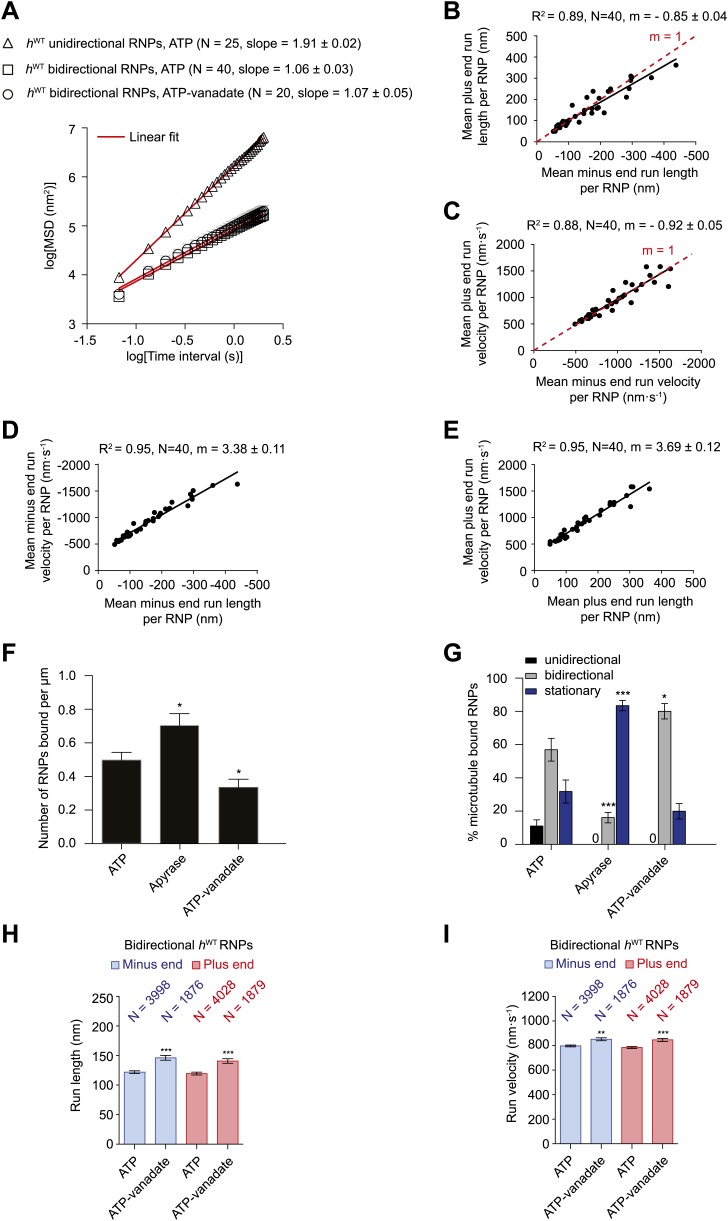
Figure 2. Characterisation of the motile properties of hWT RNPs.
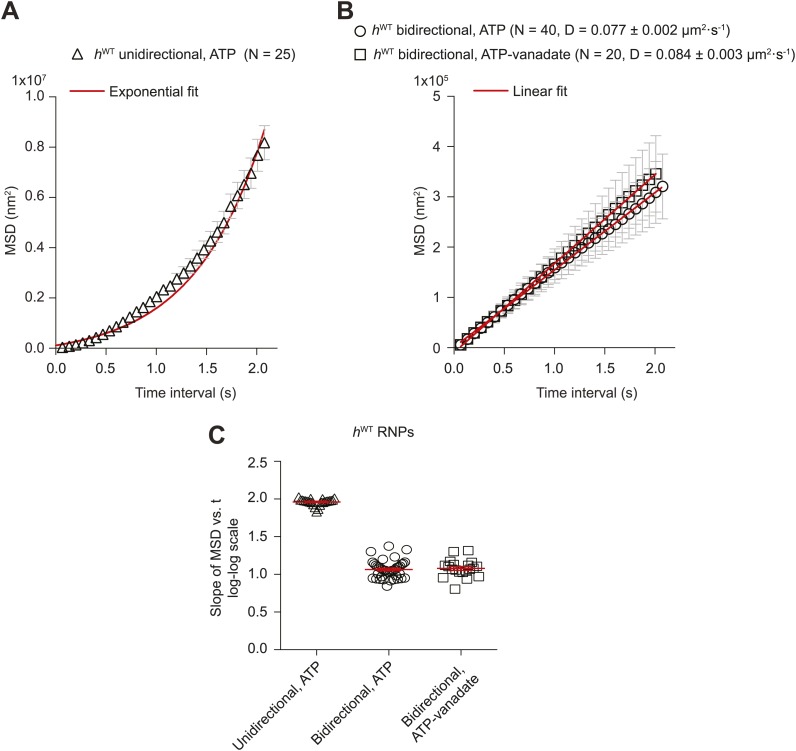
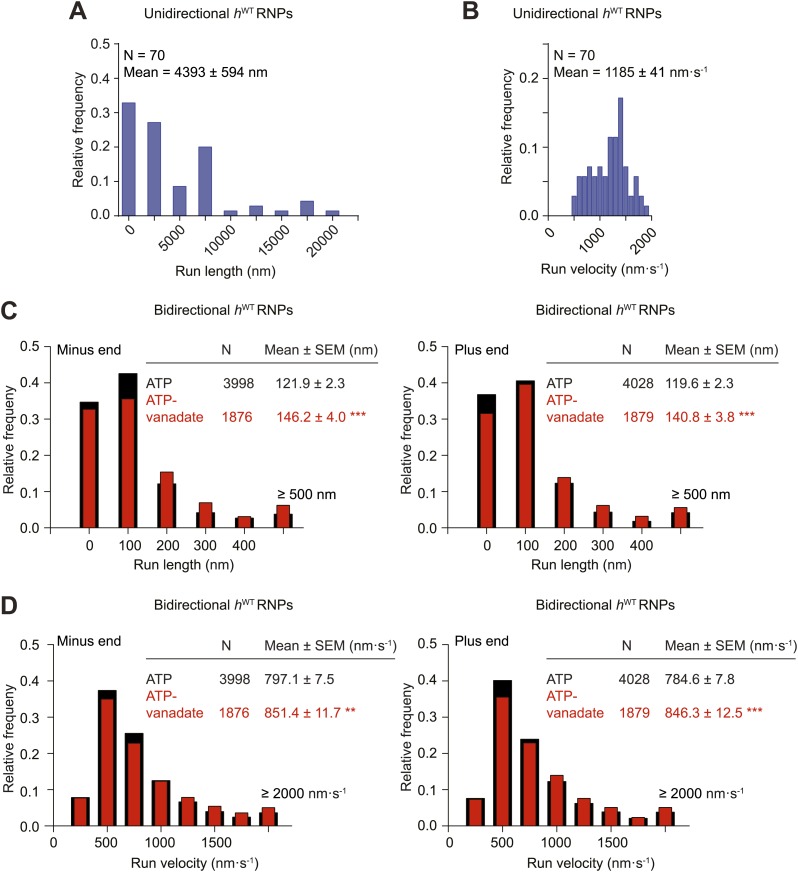
(A) Mean square displacement (MSD) of hWT RNP trajectories as a function of time plotted in a log–log format. Mean slopes (± SEM) were calculated from a linear fit to the data. Plot of MSD vs time on non-logarithmic axes is shown in Figure 2—figure supplement 1A,B. ATP, 2.5 mM ATP; ATP-vanadate, 2.5 mM ATP plus 100 μM vanadate. N, number of RNPs analysed. See Figure 2—figure supplement 1C for slopes of log–log MSD(t) for individual RNPs in each population. (B–E) Correlation analysis of mean run length and run velocity for the bidirectional subset of hWT RNPs. Strong correlations exist for individual RNPs between (B) mean minus end and mean plus end run length, (C) mean minus end and mean plus end velocity, (D) mean minus end run length and mean minus end velocity, and (E) mean plus end run length and mean plus end velocity. Only bidirectional RNPs with ≥20 runs in total were used for these analyses (note that no such cut-off was applied for the analysis in H and I). R2, correlation coefficient; N, number of RNPs analysed; m, slope. There is no significant bias in minus end vs plus end motile properties in B and C (red line represents slope expected for no bias). (F) Mean number of hWT RNPs bound per μm of microtubule per movie in the presence of 2.5 mM ATP, 20 U·ml−1 apyrase and 2.5 mM ATP plus 100 μM vanadate (ATP-vanadate). Means were calculate from values for 12 microtubules selected at random in at least three imaging chambers. (G) Mean percentage of microtubule-associated hWT RNPs that were unidirectional, bidirectional, or stationary. Means were calculated from 12 microtubules as in F. (H and I) Mean run lengths (H) and velocities (I) of individual runs of bidirectional hWT RNPs. N, number of individual runs of RNPs (number of RNPs from which the individual runs were extracted was 40 for ATP and 20 for ATP-vanadate). See Figure 2—figure supplement 2C,D for distribution of run lengths and velocities. Errors represent SEM in all panels. In F–I, ***p<0.001; **p<0.01; *p<0.05, compared to the ATP condition for the same parameter (Mann–Whitney non-parametric t test). Images for all analyses in the figure were acquired at 15 fps.


