. 2014 Apr 15;3:e01596. doi: 10.7554/eLife.01596

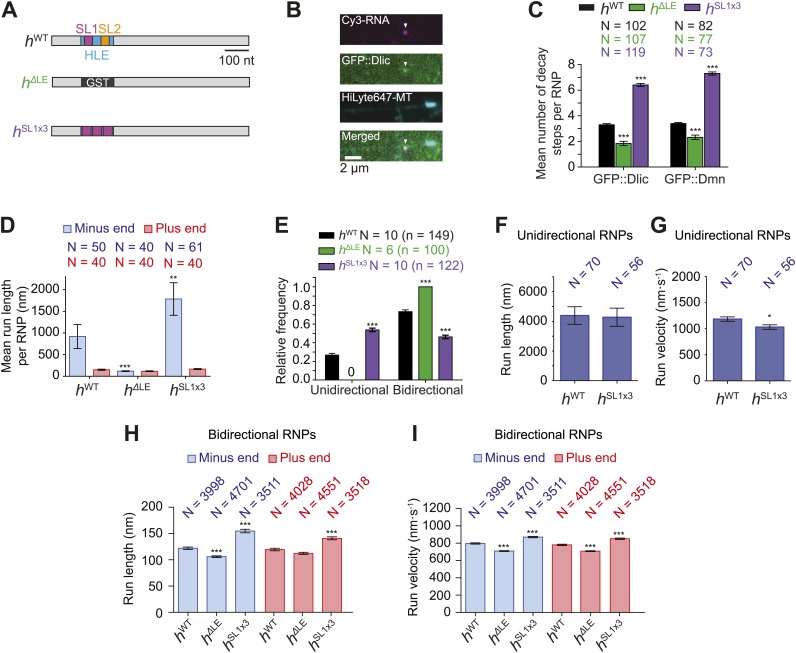
Figure 3. Manipulating the copy number of native dynein-dynactin complexes on individual RNPs.

(A) Schematic of h RNA variants fused to streptavidin aptamers and used in this study. hΔLE and hSL1x3 have replacements of the 124 nt HLE region with, respectively, a heterologous sequence from the Glutathione-S-transferase (GST) gene and three copies of stem-loop 1 (SL1) separated by short spacers. (B) Example of an RNP in vitro containing Cy3-h RNA (magenta) and GFP::Dlic (green), which is immobilised on a polarity-marked microtubule (cyan) by the omission of ATP. (C) Stepwise GFP photobleaching analysis of RNPs assembled on h RNA variants. Note significant relative changes in the copy number of Dlic and Dmn upon increasing or decreasing copy number of SL1. N, number of photobleaching traces analysed. See Figure 3—figure supplement 1B for distribution of values. (D) Mean run length per RNP for each RNA species. N, number of RNPs analysed. (E) Mean proportion of motile RNPs per imaging chamber that are unidirectional or bidirectional. No unidirectional RNPs were observed for hΔLE. N, number of chambers analysed; n, total number of RNPs. (F and G) Mean length (F) and velocity (G) of individual runs of unidirectional RNPs. N, number of runs (from 25 and 20 RNPs for hWT and hSL1x3, respectively [many RNPs have more than one run due to interruptions of bouts of minus end-directed motility by short-lived pauses]). (H and I) Mean length (H) and velocity (I) of individual runs of bidirectional RNPs. N, number of runs (from 40 RNPs each for hWT, hΔLE, and hSL1x3). In DI, all experiments were performed in 2.5 mM ATP; error bars represent SEM. ***p<0.001; **p<0.01; *p<0.05, compared to hWT values for the same parameter (Mann–Whitney non-parametric t test).

DOI: http://dx.doi.org/10.7554/eLife.01596.010

Figure 3.

Figure 3—figure supplement 1. Supplemental data on GFP photobleaching analysis of relative dynein and dynactin copy number per hWT, hΔLE, or hSL1x3 RNP.

Figure 3—figure supplement 1.

(A) Examples of traces of GFP fluorescent signals (after background subtraction) from individual hWT RNPs assembled in the presence of tagged Dlic (i, ii) or Dmn (iii, iv). Traces show stepwise decreases in fluorescence, indicative of photobleaching of single GFP molecules. (i) and (iii) are the raw traces, with (ii) and (iv) showing fitting with the Stepfinder algorithm (Kerssemakers et al., 2006). (B) Distributions and means (± SEM) of number of GFP decay steps for GFP::Dlic (top) and GFP::Dmn (bottom) for RNPs associated with hΔLE, hWT, or hSL1x3 RNAs. (C) Distributions and means (± SEM) of total GFP fluorescence at the beginning of imaging (after background subtraction) for GFP::Dlic (top) and GFP::Dmn (bottom) for RNPs associated with hΔLE, hWT or hSL1x3 RNAs. In B and C, means ± SEM were determined from raw data and N represents the number of RNPs analysed. ***p<0.001, compared to hWT values (Mann–Whitney non-parametric t test). Due to differences in fluorescence illumination in the TIR field in x, y, and z (Axelrod, 1989; Stout and Axelrod, 1989), measurements of total GFP fluorescence are likely to be less accurate than quantification of the number of stepwise decay events. However, the total GFP signal measurements provide further evidence for alterations in Dlic and Dmn copy number following manipulation of the number of SL1 elements. Note that the maximum number of dynein motors recruited by one localisation element and the proportion of recruited motors that are actively engaged during RNP transport is unknown. (D) Fluorescent Western Blot with α-Dlic antibodies revealing the levels of GFP-labelled Dlic compared to unlabelled, endogenous Dlic in the GFP::Dlic extracts used for photobleaching analysis. Predicted molecular weights of Dlic and GFP::Dlic are 54.5 kDa and 81.4 kDa, respectively. The mean percentage of total Dlic that was GFP-labelled was 0.49 ± 0.01 (mean ± SEM). Note that we previously showed that GFP::Dlic is incorporated in microtubule-associated motor complexes in accordance with its abundance in extracts relative to unlabelled, endogenously expressed Dlic (Amrute-Nayak and Bullock, 2012). Estimation of the ratio of GFP::Dmn to endogenous Dmn could not be made due to the unavailability of previously published α-Drosophila Dmn antibodies. (E) Table illustrating the calculations used to estimate dynein copy number per RNP based on stepwise photobleaching.
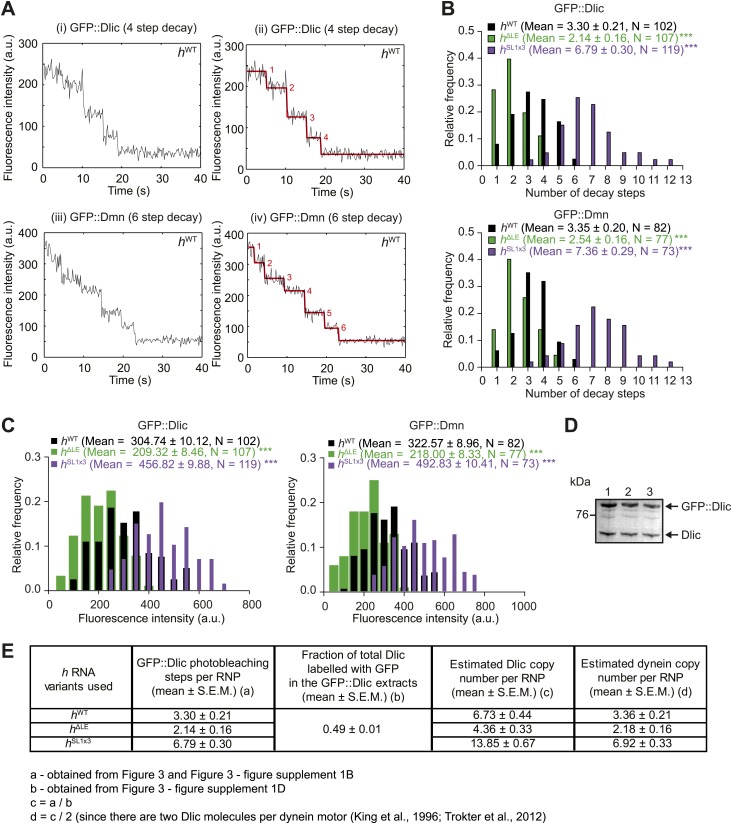
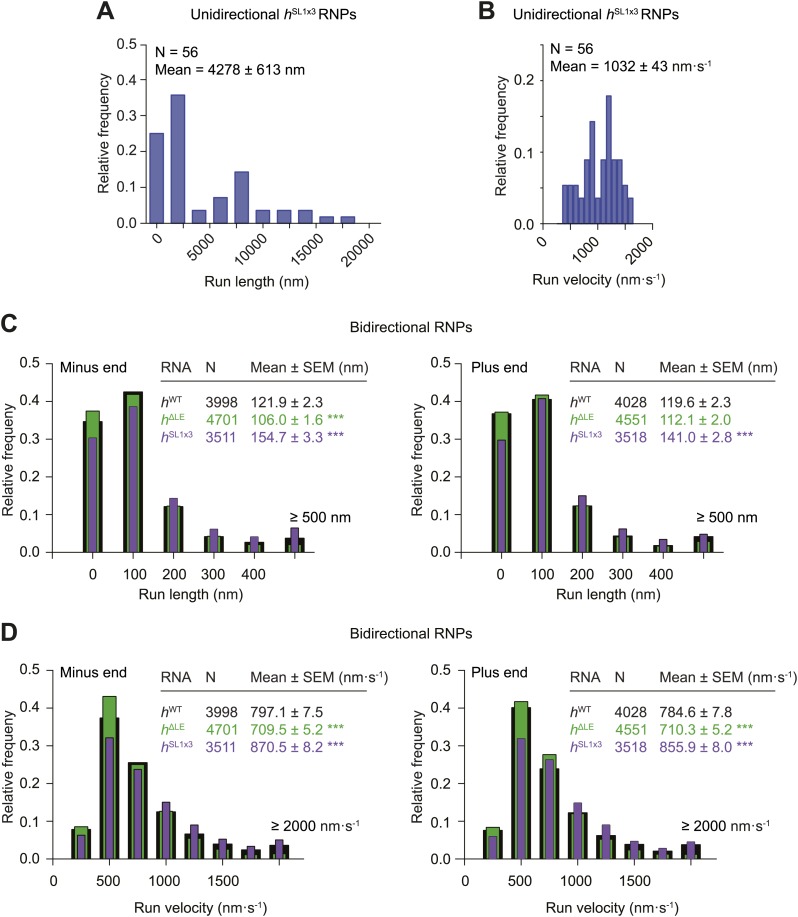
Figure 3—figure supplement 2. Distributions of run lengths and velocities of hSL1x3 and hΔLE RNPs.

Figure 3—figure supplement 2.

(A and B) Distribution of lengths (A) and velocities (B) of individual runs of unidirectional minus end-directed hSL1x3 RNPs. Note that no plus end-directed unidirectional runs were observed. N, number of runs (from 20 RNPs [individual RNPs often have more than one run due to interruptions by short-lived pauses]). See Figure 3F,G for comparison of means with those of hWT RNPs. (C and D) Distribution of lengths (C) and velocities (D) of individual runs of bidirectional hSL1x3 and hΔLE RNPs in the minus end or plus end direction compared to hWT RNPs. N, number of runs (from 40 RNPs). Note that due to the relative paucity of long or fast runs, those >500 nm or >2000 nm·s−1 were binned together in this plot.