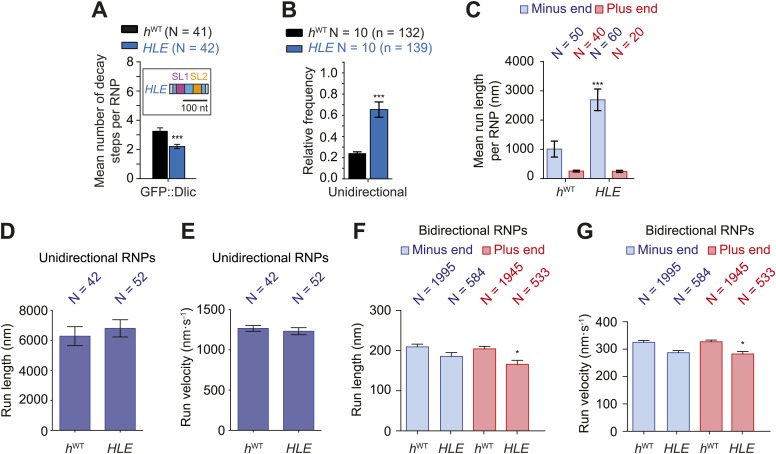
Figure 4. The HLE alone promotes unidirectional motion.
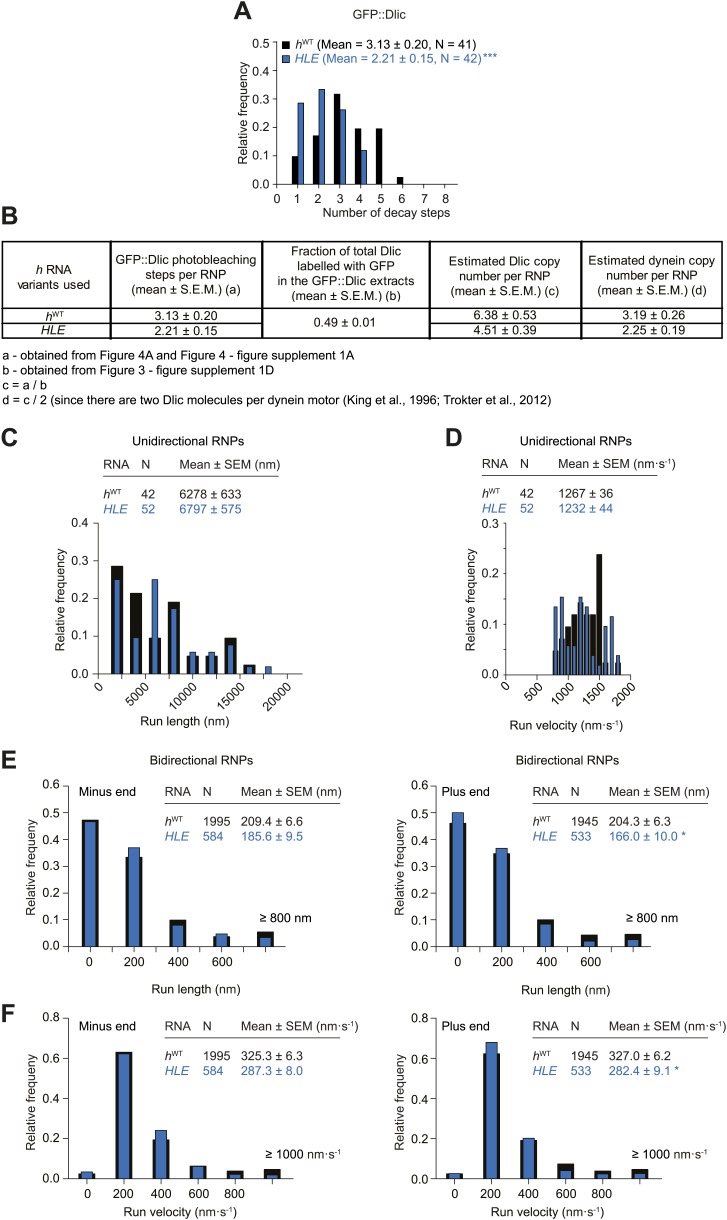
(A) Stepwise GFP photobleaching analysis of RNPs assembled on hWT or HLE RNAs; inset, schematic of HLE RNA that was fused to the aptamer sequence. Note the significant decrease in the relative copy number of GFP::Dlic on the HLE compared to hWT. N, number of photobleaching traces analysed. See Figure 4—figure supplement 1A for distribution of values. (B) Mean proportion of motile hWT or HLE RNPs that are unidirectional per imaging chamber. N, number of chambers analysed; n, total number of RNPs. (C) Mean run length per RNP of motile hWT or HLE RNPs. N, number of RNPs analysed. (D and E) Mean length (D) and velocity (E) of individual runs of unidirectional RNPs. N, number of individual runs of RNPs (from 25 RNPs each for hWT and HLE). (F and G) Mean length (F) and velocity (G) of individual runs of bidirectional RNPs (from 40 and 20 RNPs for hWT and HLE, respectively). Images for all analyses in the figure were acquired at a lower frame rate of 4.2 fps; this is because the small number of Cy3 dyes that could be incorporated into the short HLE RNA necessitated imaging with a higher exposure time. Note that the measured mean run lengths of unidirectional and bidirectional RNPs of the same species are higher at 4.2 fps than at 15 fps (Figure 3F,H), presumably due to short pauses and frequent reversals (in the case of bidirectional RNPs) being missed at the lower frame rate. Velocity of measured runs of bidirectional RNPs of the same species is lower at 4.2 fps than at 15 fps, presumably for the same reason, whereas velocity of unidirectional runs is not significantly affected by the different frame rate as short pauses have little affect on the velocity measured for such long runs (Figure 3G,I). ***p<0.001; **p<0.01; *p<0.05 (Mann Whitney non-parametric t test), compared to hWT values for the same parameter; error bars represent SEM.


