. 2014 Apr 16;3:e01967. doi: 10.7554/eLife.01967

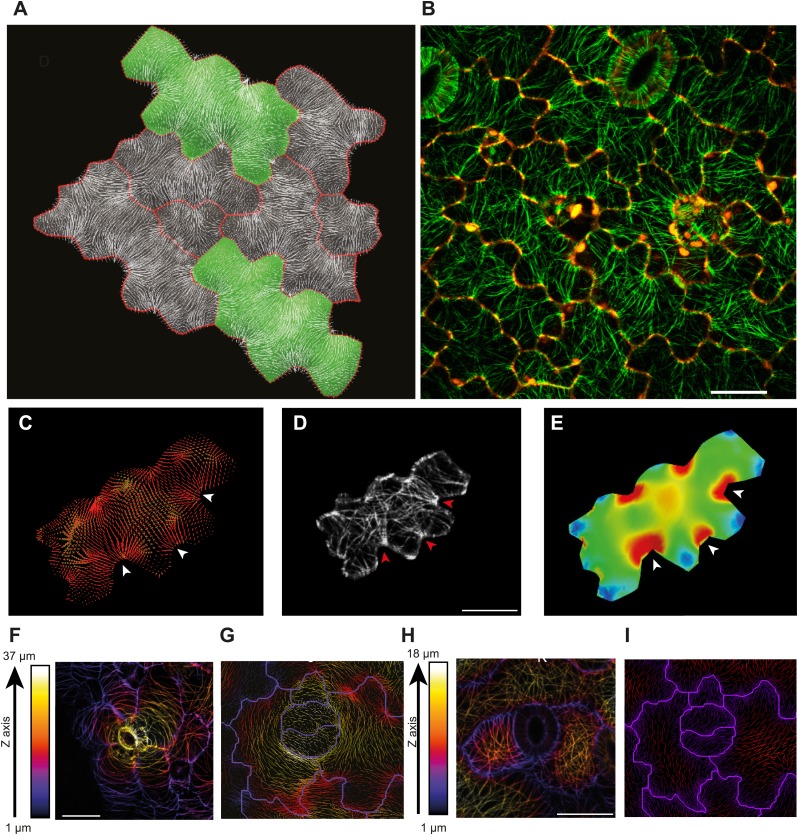
Figure 2. Microtubule patterns correlate with physical stress patterns.

(A) Mesh showing stress directions, with the corresponding microtubule organization shown in panel B. Highlighted cells in green are represented in panels CE and Figure 2—figure supplement 1A–C. (C) Largest stress direction (red) and second principal stress direction (green) in mechanical models of the pavement cell. White arrowheads indicate regions of convergence of directional tensile stresses in necks of pavement cells. (D) Microtubule (YFP-MBD) orientations correlate with the maximal stress direction predicted in the mechanical model. (E) Heat map showing the magnitude of stress distribution in the mechanical model. Arrowheads indicate regions of highest stress magnitude in neck regions. Scale bars 20 μm. (F) Circumferential distribution of microtubules surrounding elevated guard cells represented as a depth color-coded Z-stack. (G) Mechanical model of stress patterns around a stomata reproduce the observed arrangements of microtubules surrounding guard cells. (H) Microtubule organization around a non-elevated stoma and a mechanical model of stress patterns of the same (I). Scale bars 25 μm.

DOI: http://dx.doi.org/10.7554/eLife.01967.007

Figure 2.

Figure 2—figure supplement 1. Microtubule organization and correlation with stress patterns.

Figure 2—figure supplement 1.

(AC) Example cell from Figure 2A showing correlation between predicted physical stresses and microtubule organization. Scale bars 20 μm.
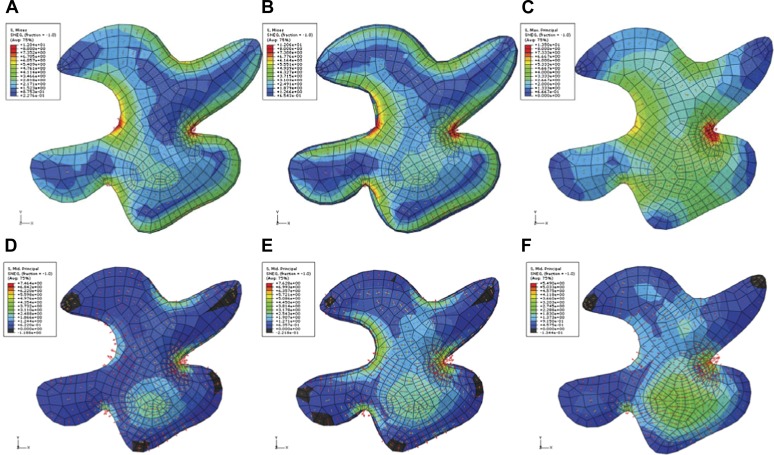
Figure 2—figure supplement 2. Simulation of single pressurized pavement cell shape A and D.

Figure 2—figure supplement 2.

3D cell with epidermal, bottom, and anticlinal wall. (B and E) The bottom wall removed and replaced with boundary conditions at the bottom of the anticlinal wall. (C and F) Surface model of epidermal wall only with anticlinal walls replaced by boundary condition. (AC) The color map (Blue to Red) shows the value of the first principal stresses. (DF) The color map shows the value of second principal stresses. Blue to red mark positive values (tension). The black is negative values (compression).
Figure 2—figure supplement 3. Microtubule organization and correlation with stress patterns.

Figure 2—figure supplement 3.

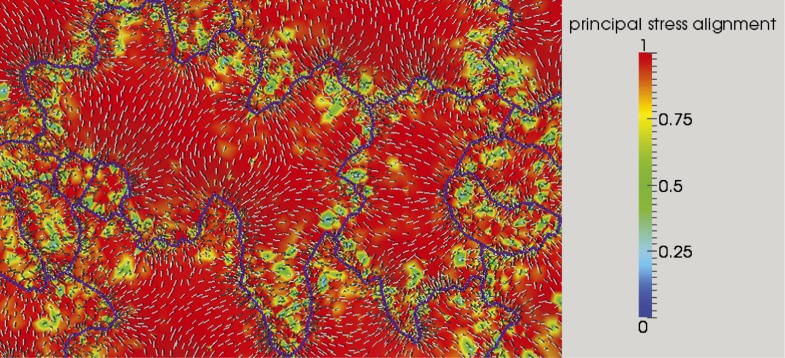
Color map of the cosine of angle between first principal stress without (white lines) and with anisotropic material and feedback to stress direction (black lines).