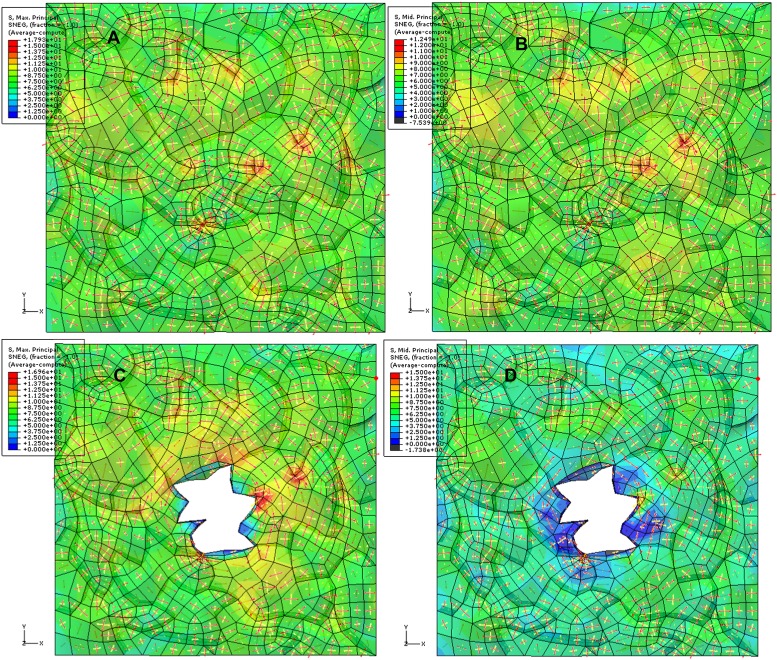
Author response image 3.
Simulation of ablation with 3D anticlinal walls included. The color map shows the value of first (A, C) and second (B, D) principal stresses (blue-low, red-high) before (A, B) and after (C, D) ablation. Red and yellow arrows (red: first principal stress, yellow: second principal stress). We observe circumferential rearrangement of main principal (tensile) stress around the ablation in the epidermal wall with some compressive (black in color scale) second principal stress in anticlinal walls.

