
Figure 5.
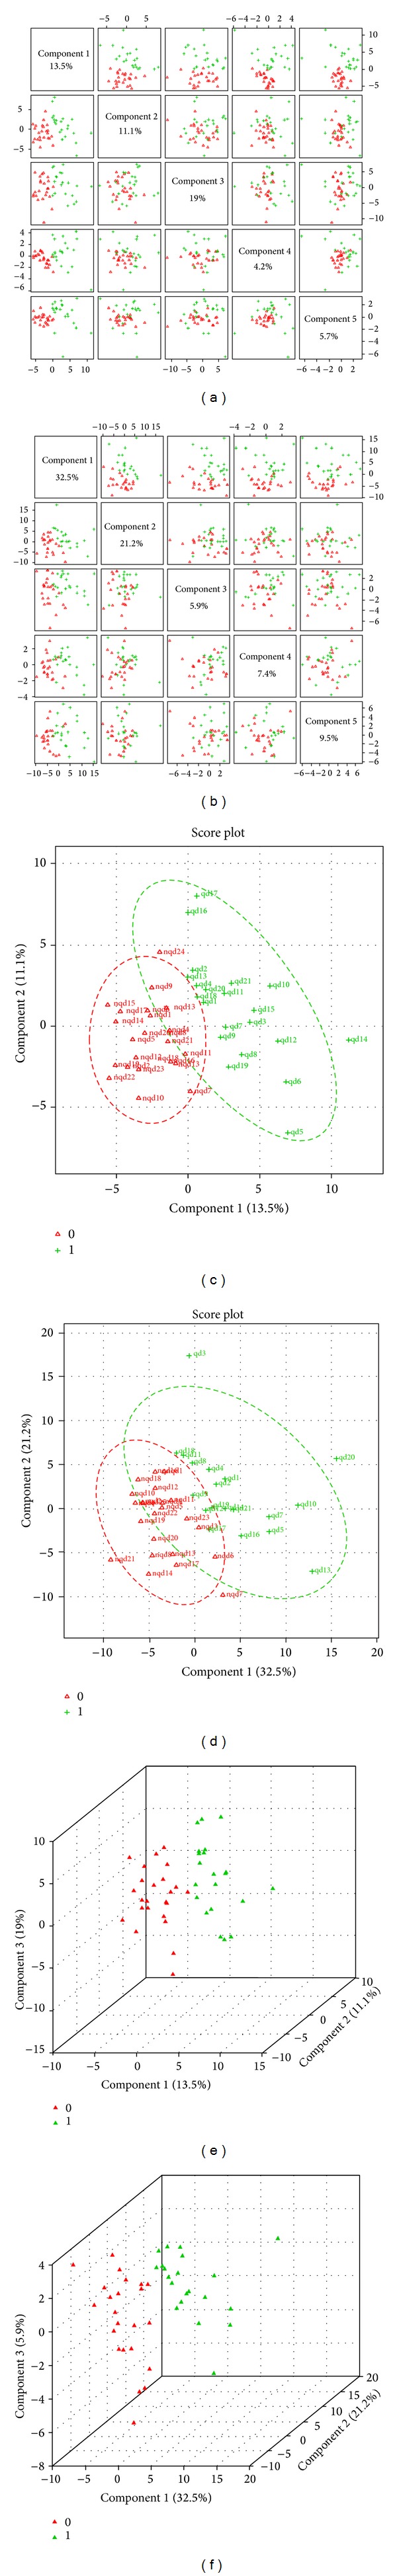
PCA and PLS-DA scores in Qi deficiency and non-Qi deficiency groups. Note. (a) The top five PCs overview for CPMG; (b) the five PCs overview for LED; (c) and (e) 2D and 3D score plot of PLS-DA for CPMG; (d) and (f) 2D and 3D score plot of PLS-DA for LED. In (c) and (d), nqd = non-Qi deficiency group, qd = Qi deficiency group. In (e) and (f), Red triangle = non-Qi deficiency group; green triangle = Qi deficiency group. For CPMG, R 2 X = 0.42634, R 2 Y = 0.86034, and Q 2 = 0.88. For LED, R 2 X = 0.38967, R 2 Y = 0.8136, and Q 2 = 0.9375.