
Figure 7.
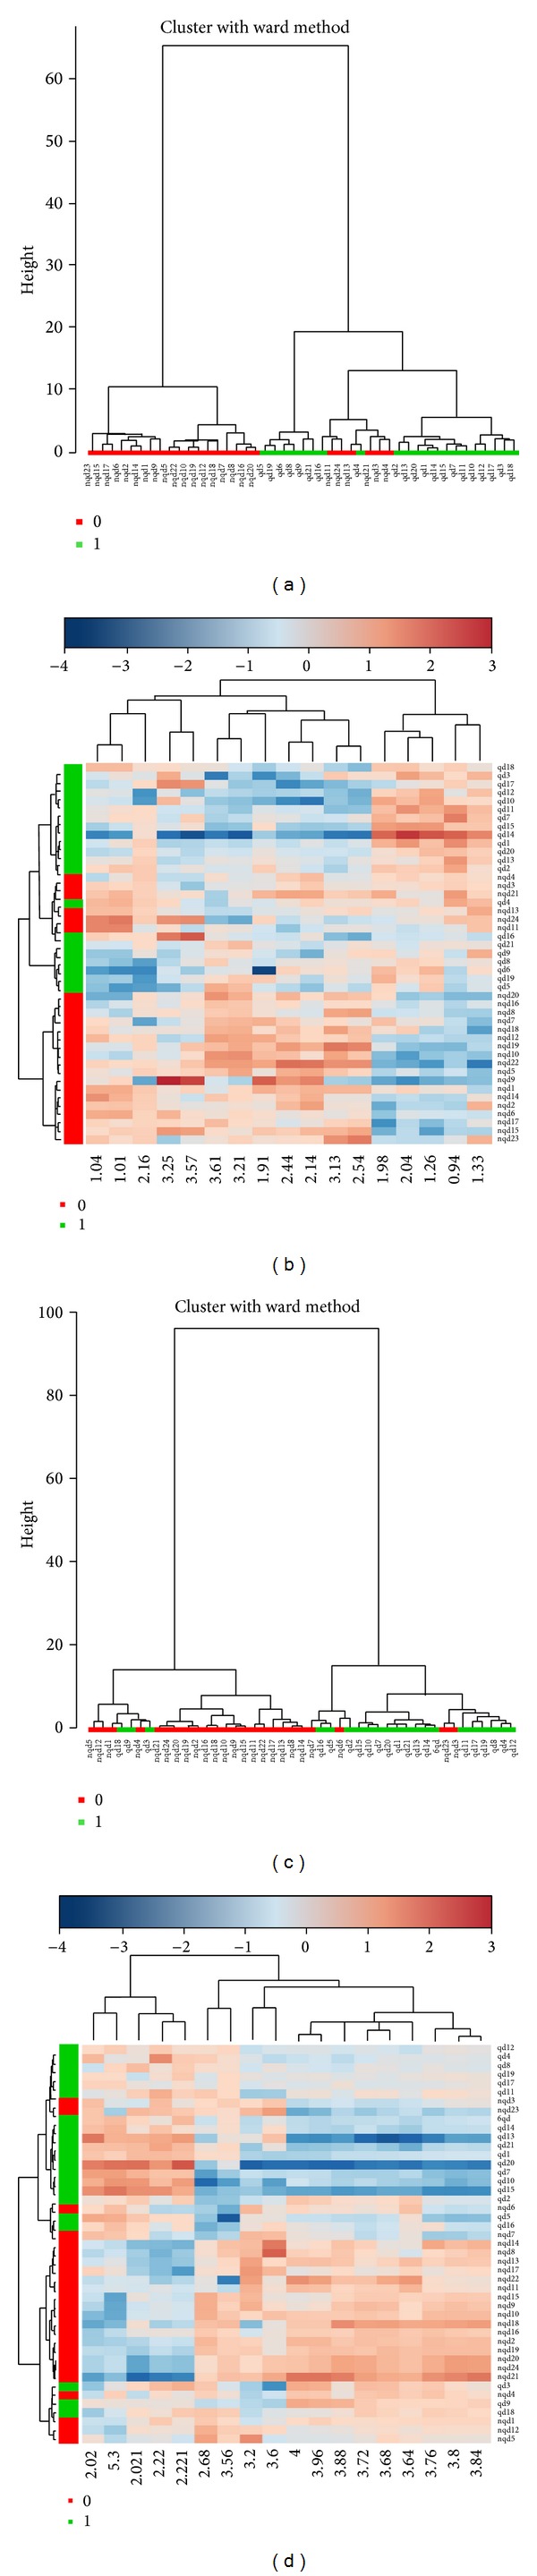
The dendrogram and heatmap of hierarchical clustering for CPMG and LED. Note. (a) The dendrogram for CPMG; (b) the heatmap for CPMG; (c) the dendrogram for LED; (b) the heatmap for LED. 0: non-Qi deficiency group, 1: Qi deficiency group.
Official websites use .gov
A
.gov website belongs to an official
government organization in the United States.
Secure .gov websites use HTTPS
A lock (
) or https:// means you've safely
connected to the .gov website. Share sensitive
information only on official, secure websites.
The dendrogram and heatmap of hierarchical clustering for CPMG and LED. Note. (a) The dendrogram for CPMG; (b) the heatmap for CPMG; (c) the dendrogram for LED; (b) the heatmap for LED. 0: non-Qi deficiency group, 1: Qi deficiency group.