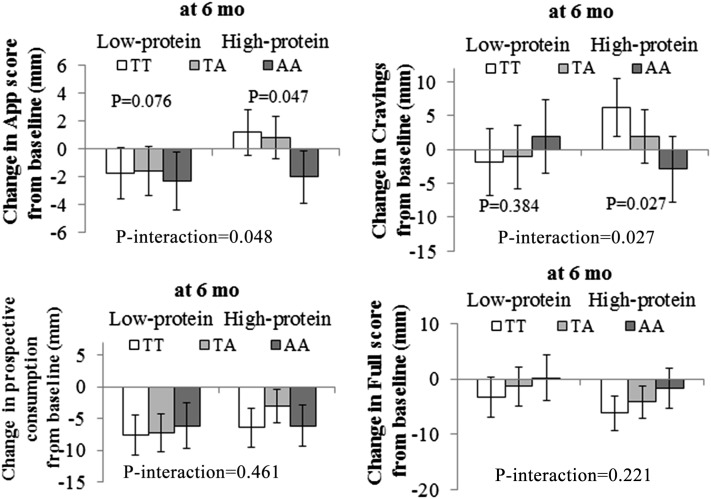
FIGURE 1.
Mean (±SE) effects of the FTO rs9939609 genotype on 6-mo changes in appetite measurements in response to dietary protein. Data were included for 84 (TT), 146 (TA), and 68 (AA) participants in low-protein diet groups and 100 (TT), 154 (TA), and 57 (AA) participants in high-protein diet groups at 6 mo. Data were calculated by using general linear models after adjustment for age, sex, ethnicity, weight change, and baseline values for respective phenotypes. To test for interactions, generalized linear models were used to examine genotype-by-intervention interactions as independent predictors of changes in primary endpoints after adjustment for age, sex, ethnicity, baseline BMI, weight change, and the baseline value for the respective outcome trait. All reported P values were nominal and 2-sided, and P = 0.05 was considered significant. App, appetite.

