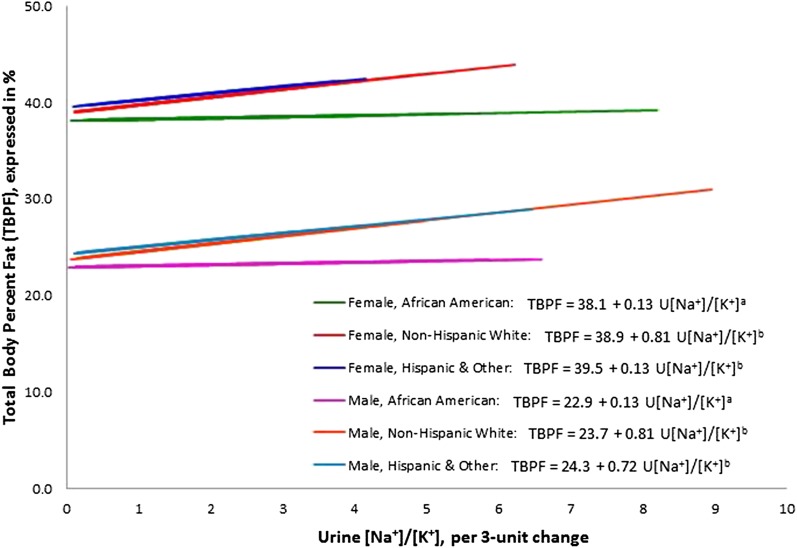
FIGURE 2.
Linear regression of U[Na+]/[K+] on TBPF and race interactions, adjusted for age, sex, diabetes mellitus, systolic blood pressure, diastolic blood pressure, and serum glucose and triglyceride concentrations (covariates from model 2). Values are plotted at the mean levels of the covariates. Lines denoted by different letters have a significantly different slope (P-interaction < 0.10) from that of the referent category of African Americans. TBPF, total-body percentage fat; U[Na+]/[K+], ratio of urinary Na+ to K+.

