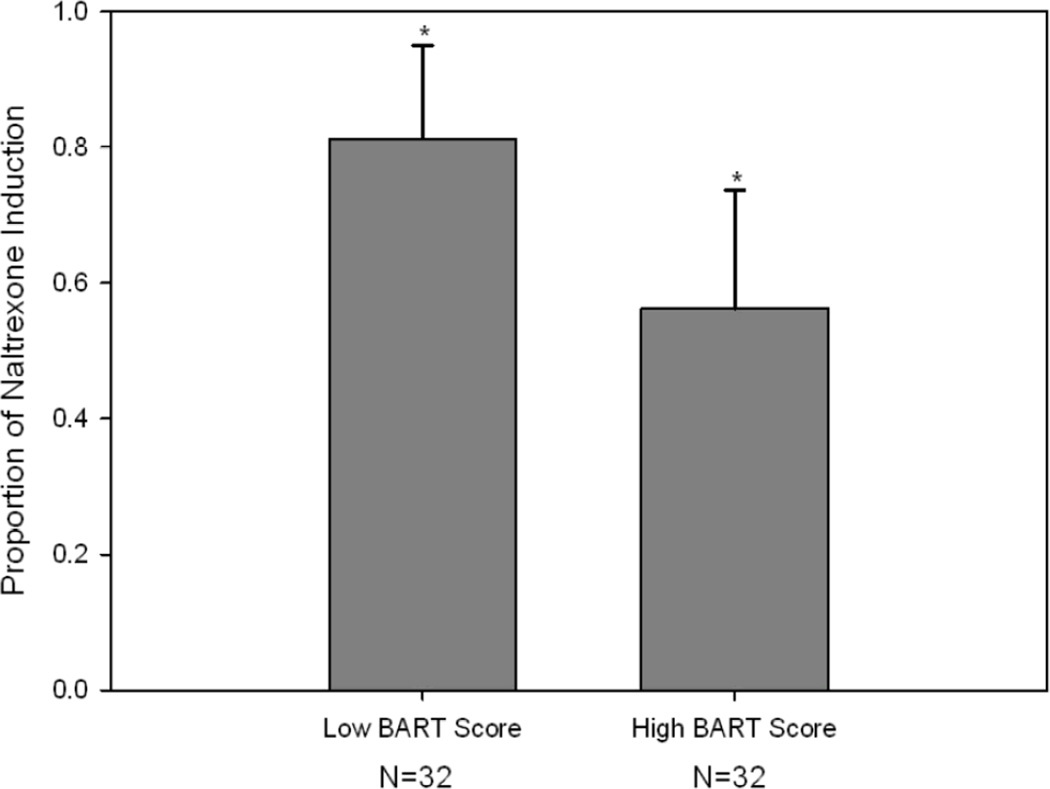
Figure 2.
The proportion of individuals who were inducted onto naltrexone by BART performance. The BART score was split at the median value of 35 pumps. Those below 35 represent the "Low BART Score" group and those above 35 represent the "High BART Score" group. The error bars represent the upper limit of the 95% confidence interval of the proportions. These data are based on assessments collected at study intake.

