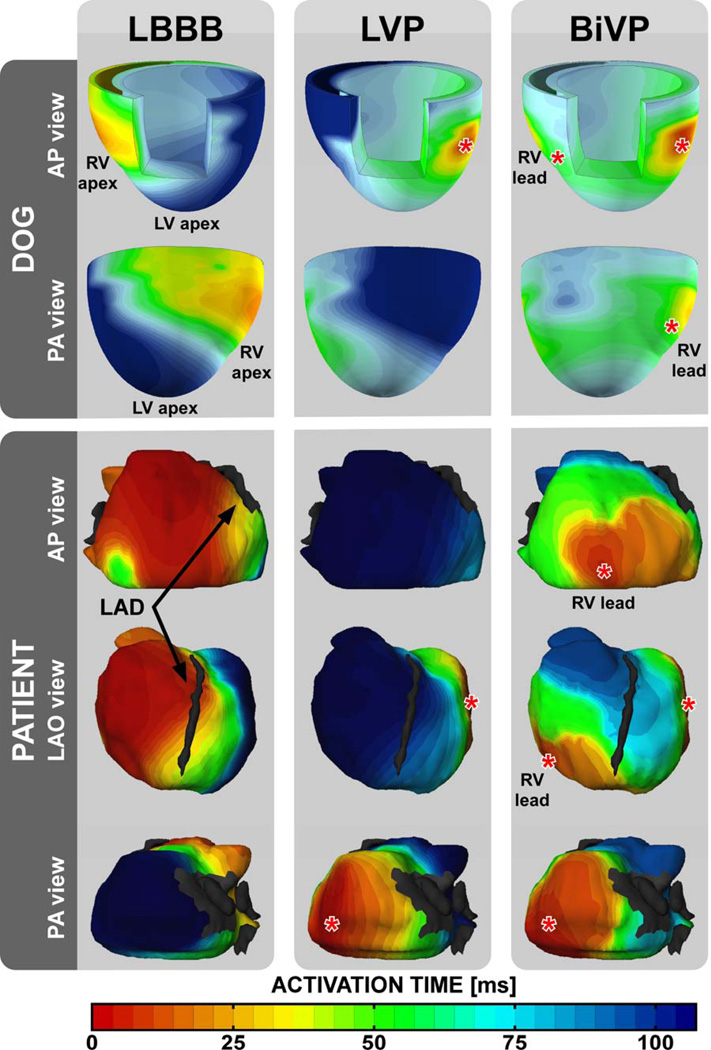
Figure 1. Electrocardiographic mapping in a dog and a patient with nonischemic heart failure and LBBB.
Isochronal maps show timing of electrical activation during baseline, LVP, and BiVP. Black arrows indicate the left anterior descending coronary artery (LAD). The gray patch in the PA view represents the segmentation of the mitral orifice. Red asterisks indicate pacing sites. AP = anterior-posterior, LAO = left anterior oblique, and PA = posterior-anterior.

