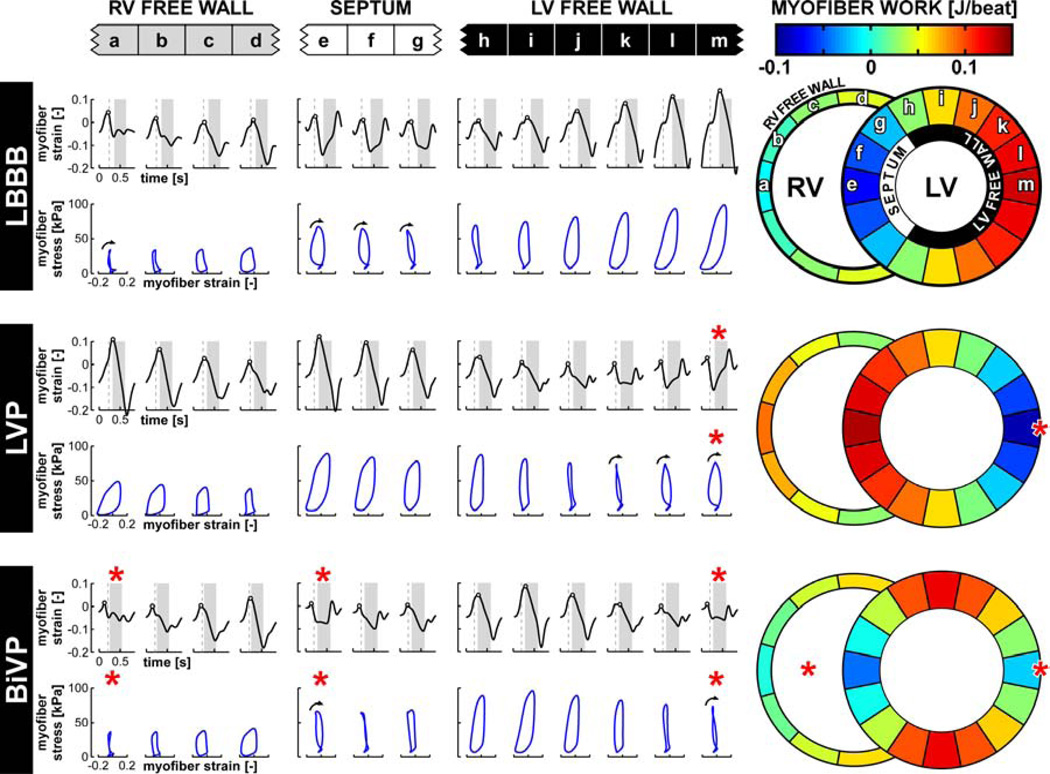
Figure 3. Simulated local myofiber mechanics in a failing heart during LBBB and pacing.
Time courses of natural myofiber strain are plotted in black. Red asterisks indicate pacing sites. Vertical dashed lines indicate moment of mitral valve closure and LV ejection is highlighted in grey. Black circles indicate onset of systolic shortening. Relations between myofiber stress and myofiber strain are plotted in blue. Black arrows indicate segments with a clockwise stress-strain relation, indicating negative myofiber work. Color maps indicate myofiber work per ventricular wall segment.

