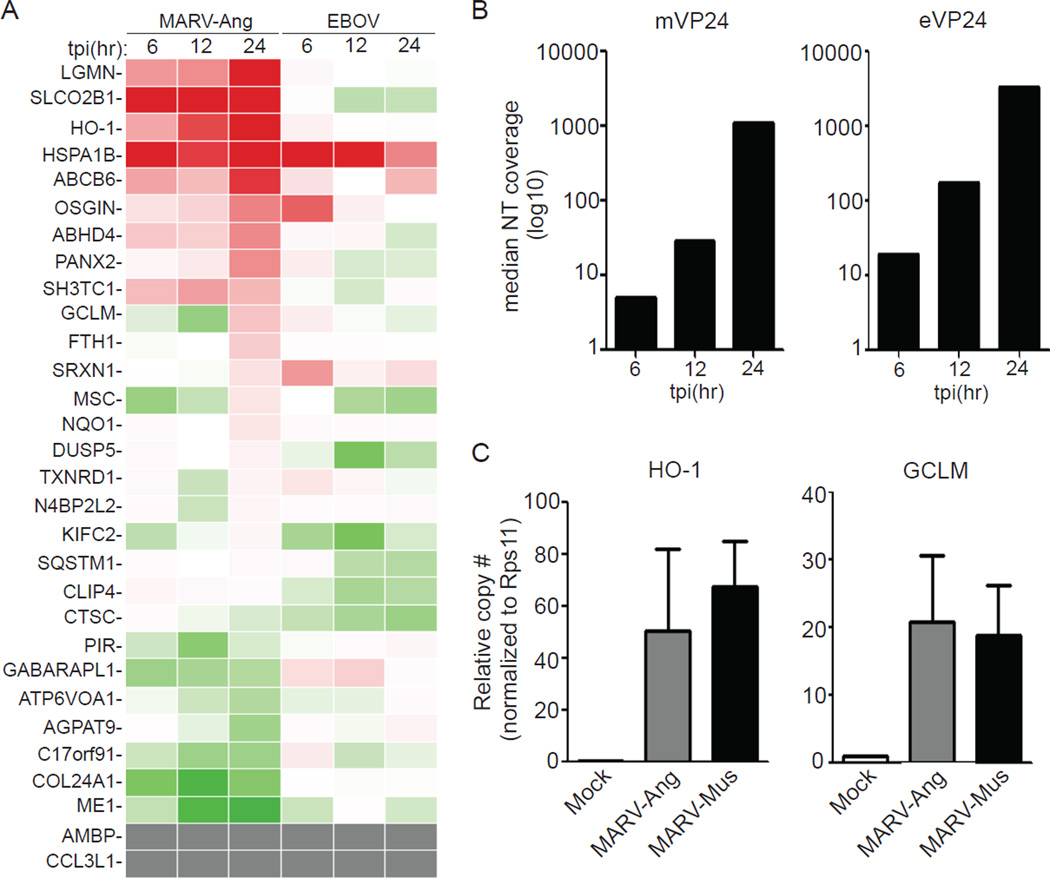
Fig. 4. MARV infection upregulates the Nrf2 antioxidant pathway.
(A and B) THP-1 cells were infected with MARV-Ang or Zaire EBOV (MOI=3) and subjected to expression analysis by mRNA-seq. (A) Heat map displaying the expression profile of 30 Nrf2-activated genes (Chorley et al., 2012)). Red indicates up-regulated genes (max induction = 8.55 fold relative to mock-infected cells). Green indicates down-regulated genes (lowest value=0.2 fold relative to mock-infected cells). Gray indicates genes undetected in the mRNA-seq. (B) mVP24 and eVP24 mRNA expression levels represented as median nucleotide coverage. (C) THP-1 cells were infected with MARV-Ang or MARV-Mus (MOI=1) and subjected to qRT-PCR. Values were normalized to RPS11. Mock sample contains a single replicate; MARV-Ang and MARV-Mus represent the mean and SEM of triplicate samples. See also Figure S4.

