
Figure 6.
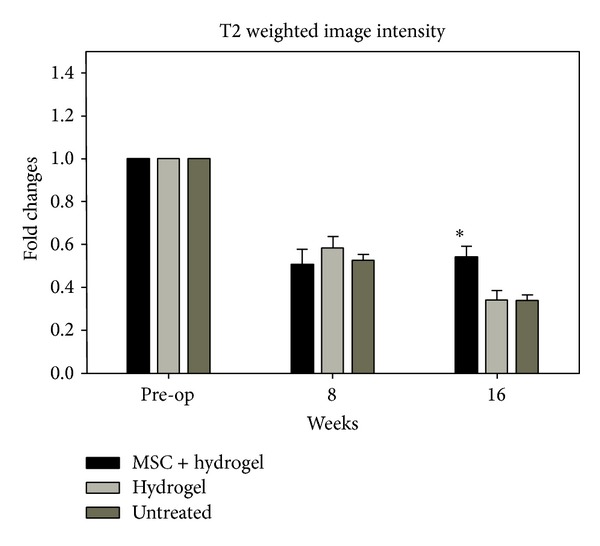
Magnetic resonance imaging results of normalized T2 values. Magnetic resonance imaging (MRI) analysis was performed before operation, 8 weeks after defects were created, and 8 weeks after transplantation (16 weeks). The normalized T2 value of group I after transplantation with MSC + hydrogel shows significant difference between group II and group III. ∗ indicates significance at P < 0.05.