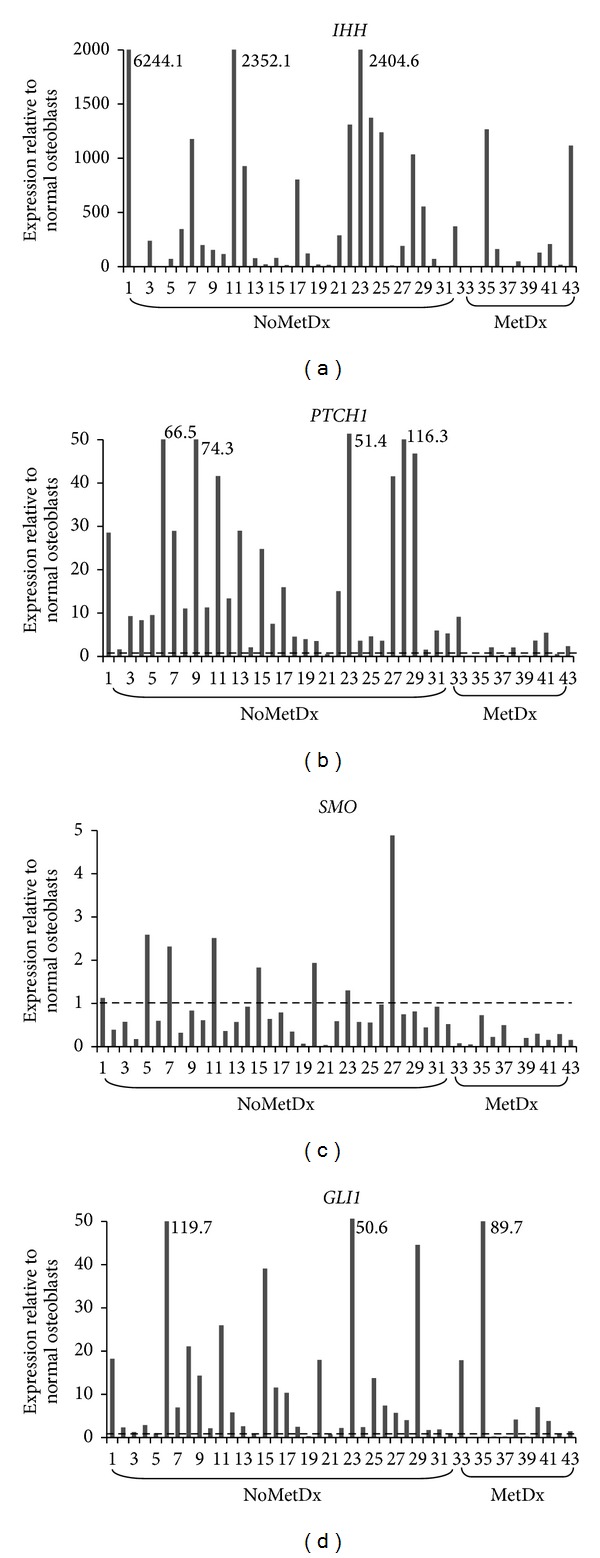
Figure 1.

Expression levels of IHH, PTCH1, SMO, and GLI1 in 43 osteosarcoma tumors relative to normal osteoblasts. Expression levels in tumors were normalized to the average level of 2 normal osteoblast samples and presented as fold change. Fold changes greater than the y-axis are labelled next to the representing bars (NoMetDx = no metastasis at diagnosis; MetDx = metastasis at diagnosis).
