Figure 3.

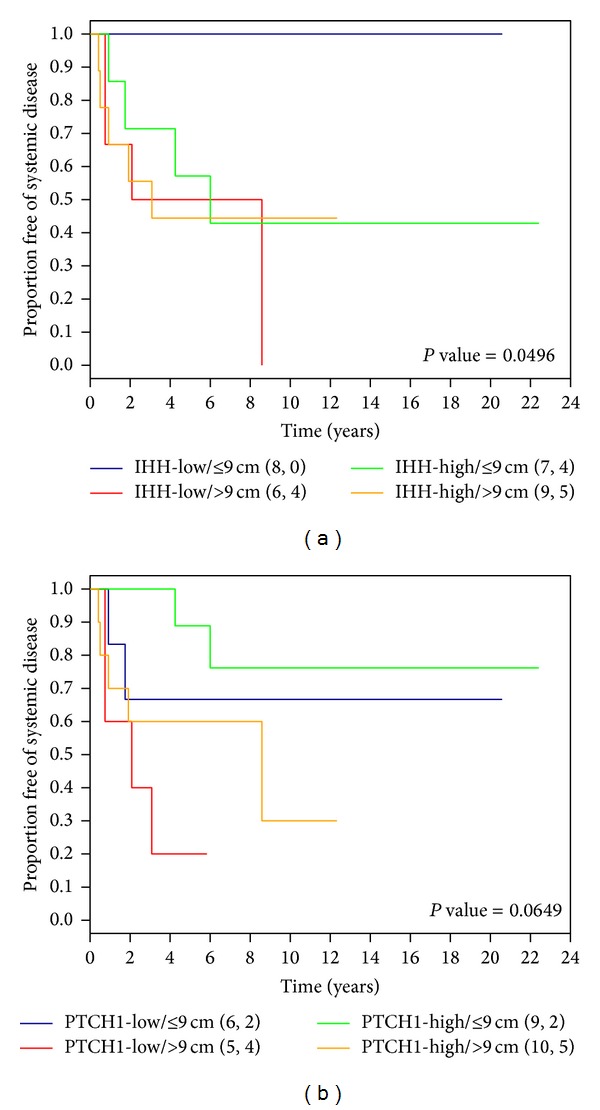
Kaplan-Meier survival curves of systemic disease-free survival for patients without metastasis at diagnosis in combination with tumor size and (a) IHH or (b) PTCH1 expression status. P value = Log-Rank P value.

Kaplan-Meier survival curves of systemic disease-free survival for patients without metastasis at diagnosis in combination with tumor size and (a) IHH or (b) PTCH1 expression status. P value = Log-Rank P value.