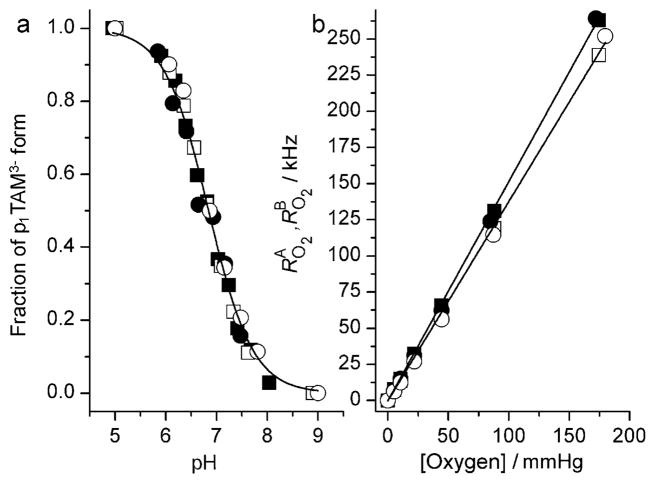
Figure 3.
a) Dependency of the fraction pA of the p1TAM3− form on the pH calculated from FT-EPR spectra measured in Na-phosphate buffer, 150 mM NaCl, at different buffer concentrations: 0 (○), 1 (●), 2 (■), and 5 mM (□). Solid lines represent the best fit by a conventional titration curve yielding identical values of pKa2 =(6.85 ± 0.05). b) The dependency of oxygen-induced relaxation rates, RO2A (filled symbols) and RO2b (open symbols), on the oxygen partial pressure calculated from FT-EPR spectra acquired at pH 4.5, pH 10 (circles), and pH 6.9 (squares). Lines represent the best linear fits yielding the values of the bimolecular rate constants, kO2A =1.51 kHzmmHg−1 and kO2B =1.38 kHzmmHg−1.

