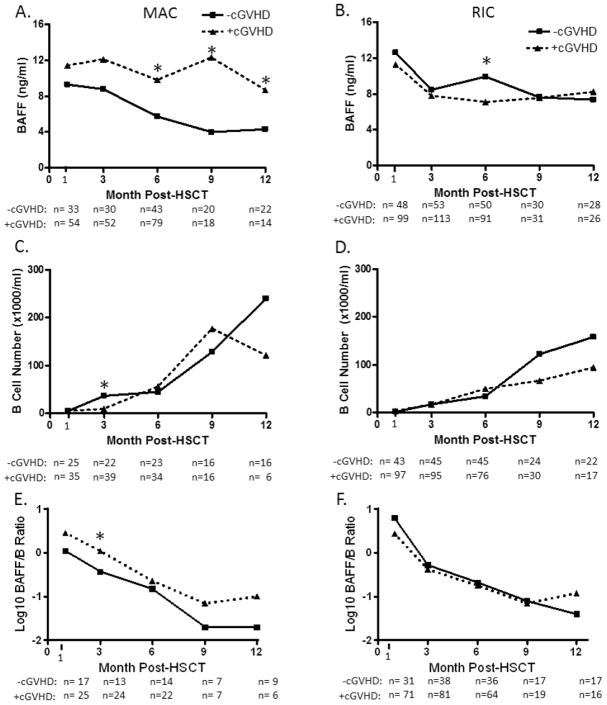
Figure 2. Patterns of BAFF levels, B-cells and BAFF/B-cell ratios after stem cell transplantation before cGVHD onset.
Serial values during the first year after transplant for patients who received eitherMAC (three left panels, A, C, and E) or RIC (three right panels, B, D, and F) prior to HSCT. Patients who later developed cGVHD (triangles) are compared to patients who did not develop cGVHD (squares).
*Indicates differences that are statistically significant (p<0.05).
Median values and ranges (in parentheses) are listed for those that were significantly different after MAC are as follows: 6 months: yes cGVHD 9.79 (0.62-58.43) vs no cGVHD 5.71 (0.08-34.49) ng/mL, p=0.025; 9 months: yes cGVHD 12.3 (1.75-37.38) vs. no cGVHD 3.99 (0.83-31.82) ng/mL, p=0.004; 12 months: yes cGVHD 8.68 (2.37-22.17) vs. no cGVHD 4.3 (3.48-25.3) ng/mL, p=0.02); or after RIC are as follows: 6 months: yes cGVHD 7.09 (0-26.01] vs no cGVHD 9.92 (0-80.49) ng/mL, p=0.05). Significant differences in total B cell numbers (median values with range in parentheses) are listed as follows: 3 months after MAC: yes cGVHD 10 (0- 631.41) versus no cGVHD 37 (0-434.64) cells/uL, p=0.008; BAFF/B-cell ratios were calculatedas previously described and are depicted on a log scale. Significant difference was determined at the 3 month timepoint after MAC with median values and ranges (in parentheses) as follows: yes cGVHD 1.11 (0.05-20.07)vs No-cGVHD 0.37 (0.03-10.75), p=0.01.

