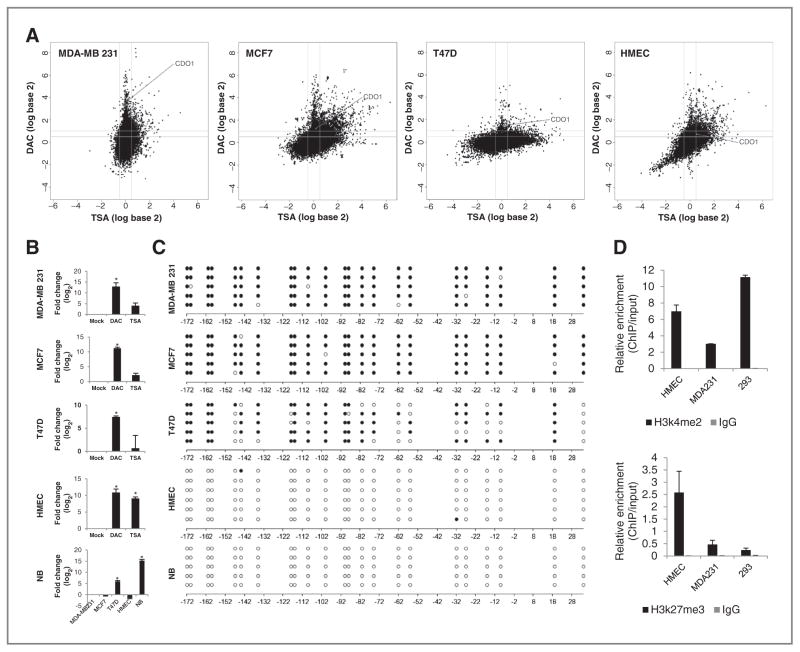
Figure 1.
Silencing of CDO1 is associated with DNA promoter hypermethylation or repressive chromatin structure. A, appearance of CDO1 within the breast cancer hypermethylome. Cell lines were treated with either 5 μmol/L DAC for 96 hours or 300 nmol/L TSA for 18 hours. Gene expression changes (analyzed on 4 × 44 K Agilent platform) are plotted by fold change (log scale) after DAC (y-axis) or TSA (x-axis) treatment. B, quantitative mRNA expression of CDO1 in DAC- (5 μmol/L 96 hours) or TSA- (300 nmol/L 18 hours) treated cells is shown in fold change (log2) relative to mock-treated cells. Expression of CDO1 in normal breast (NB) is shown in relation to basal expression levels of CDO1 in other cell lines. Group comparisons were carried out using Student t test. *, P < 0.05. C, bisulfite sequencing of the CDO1 promoter region from −192 bp to +60 bp relative to the transcription start site (TSS). White and black circles represent unmethylated and methylated CpG dinucleotides, respectively. D, ChIP at the CDO1 promoter region from −154 bp to −29 bp relative to TSS for α-H3k4me2 and α-H3k27me3. Data presented are the mean levels of enrichment relative to input obtained by real-time PCR from 2 independent experiments ± SEM.

